

From Wikipedia Commons
Over the past year, I based a lot of research off of former work by Tyler Dellow. It is a bit funny because I actually never read any of Dellow’s work until well after I started writing about underlying metrics in hockey. I knew of him, but mostly was brought up on Gabriel Desjardins, Eric Tulsky, Ben Wendorf (yes, Hockey-Graphs’ own Wendorff), and a few others. It is also a bit difficult now because Dellow’s website has gone dark with his hiring, which removed the work I quoted or built upon.
One Dellow article that will be severely missed is Two Graphs and 480 words will convince you on Corsi.
Dellow presented analytical data in simple and effective ways. It made understanding of complex concepts -such as regression in goal differentials- easy.
Relationship between shot and goal differentials
Figure 1: Relationship for forwards
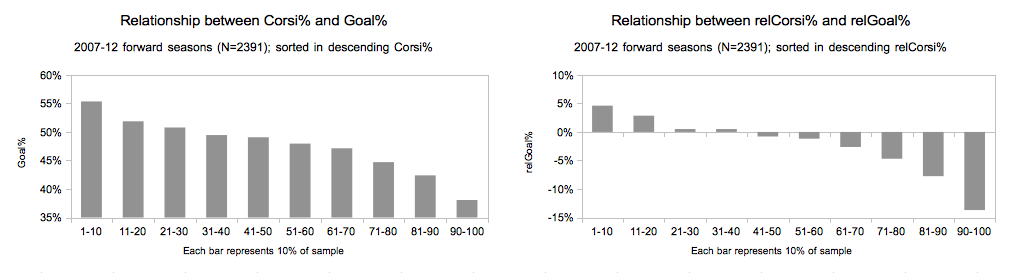
Dellow’s first graph looked much like the bar graph on the above left. Each forward between 2007-12 was sorted by Corsi%, then divided into 10 equal sized groups. The bars shows the average goal differential for each group. There is a relationship between a player’s Corsi% and Goal%. To add another layer, we see that this holds true when you look at relative stats (team’s % when the player is on the ice subtracted by team’s % when the player is off the ice). The reason why we see a flattening in the middle is due to the normal shape of the population distribution.
Figure 2: Relationship for defensemen
 Click the image to expand
The relationship holds true for defensemen as well. However, the defenders spread out less than their forward counterparts.
Alright. Players who tend to out shot-attempt their opposition also tend to outscore their opposition. That is a useful trend, but the two are not always the same. They differ quite often for individual players. Are those players special?
Regression of difference between shot and goal differentials
Figure 3: Regression in forwards

Dellow’s second graph looked much like the bar graph on the above left. Each player had the difference between their Corsi% and Goal% calculated (Corsi%-Goal%) for two conesecutive seasons. The data set was sorted in from the largest positive difference in the first season to the largest negative difference. The data set was then split into 10 separate groups and the average differences for both seasons were calculated. The second graph is the same but uses relative values.
Every single group had a larger difference in their first year than the next year. Note, this is not the same as every player having a larger difference in their first year than the next year. It’s just an average. The largest changes occur at the extremes. The graph shows players who have very large differences between their Corsi% and Goal% tend to not sustain that difference.
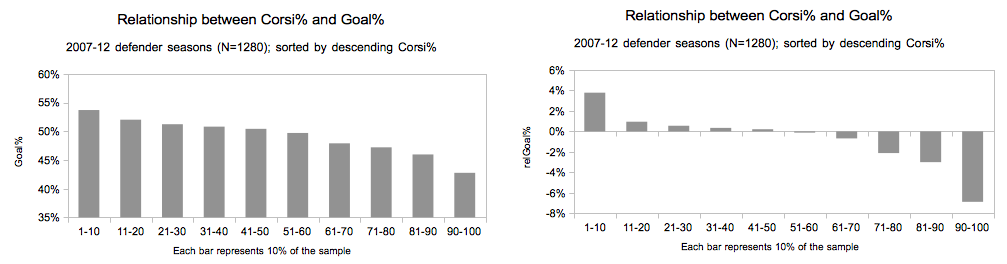
Figure 4: Regression in defensemen
 Click the image to expand
Yet again, the relationship holds true for defensemen as well. There have been some who say Corsi% is not equally relevant for defenders as forwards, but initial testing seems to indicate differently.
The later two graphs only indicate that the gap between a player’s Corsi% and Goal% will decrease as a skater plays more games.
Which leads to another question: is one moving more so towards the other?
Goal differentials regress towards shot differentials
There are multiple ways to look at this. One way is to look at what tends to change more, or which stat has a more significant relationship with its own future.
Figure 5: Relationship between past and future Corsi and goal differentials
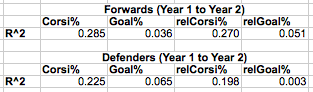
There you have it. A player’s Corsi% between year one and year two has a far more significant relationship than Goal%. In these regressions, Goal% is moving more towards Corsi% than vice versa.
The reasons why Goal% is the stat that regresses is likely similar -if not the same- to why there is a difference in the first place. While an individual is not the sole driver of their own Corsi% due to contextual nuances (ex: usage effects), Goal% has additional outside factors. On-ice percentages are a major driver of Goal%, but players have difficulty in controlling the on-ice percentages experienced while they are on the ice. For example, there is almost no sustainability in a defenseman’s on-ice save percentage.
It should be noted, that this doesn’t mean Corsi is everything or infallible. Nor does it mean that Goal% with regression added couldn’t possibly have value. It does mean though that strict Corsi% is more informative than strict Goal%.
Extra:
For those who did not get to read some of Dellow’s work, or just want to look back, I do have two other pieces built on his work here:

Tell me you misspelled my last name because of the “Garreth” joke.
What you talking about….
I already forgot about it…
I swear…
I do not have it bookmarked or anything…
https://twitter.com/BenjaminWendorf/status/514186625937448960
I fixed it… although I thought about changing it to Wendorth
There are actually people who spell it with two Fs out there. Neanderthals.
And I learned something today.
Apparently people are actually named Gareth.
Big name in my field of research, Gareth Austin. Also, a character on the original The Office.