We’re back at it again!
Rhys and Garret update you on what’s going on at Hockey-Graphs.com while also talking about Justin Abdelkader’s new contract and the NHL’s scoring problem.

We’re back at it again!
Rhys and Garret update you on what’s going on at Hockey-Graphs.com while also talking about Justin Abdelkader’s new contract and the NHL’s scoring problem.

“Patrick Wiercioch – Ottawa Senators” by Lisa Gansky – Flickr: IMG_6499. Licensed under CC BY-SA 2.0 via Commons.
Hockey Talk is a (not quite) weekly series where you will get to view the dialogue amongst a few of the Hockey-Graphs’ contributors on a particular subject, with some fun tangents.
This week we look at what makes up an effective defensemen and why the eye test sometimes differs from the results:
We’re back at it again!
Rhys and Garret update you on what’s going on at Hockey-Graphs.com while also talking about faceoffs, some early losing and winning streaks.
Image courtesy of picswallpaper.com
Two of Hockey Graphs contributors, Josh Weissbock and MoneyPuck, along with two Simon Fraser University professors, Tim Schwartz and Oliver Schulte, are organizing the first ever Vancouver Hockey Analytics Conference (#VanHAC).
This is not the first hockey analytics conference, as there have been a few popping up in recent years, including those in Alberta, Ottawa, Pittsburgh, Washington DC and Rochester.

“Dustin Brown and the Stanley Cup” by JulieAndSteve – Flickr: Dustin Brown and the Stanley Cup!. Licensed under CC BY 2.0 via Commons.
Hockey Talk is a (not quite) weekly series where you will get to view the dialogue amongst a few of the Hockey-Graphs’ contributors on a particular subject, with some fun tangents.
This week we look at dump and chase systems and hitting:
We’re a day late (again), sorry. Just pretend you are listening to this yesterday (unless you have us on iTunes, then you did get this on time)!
Rhys and Garret update you on what’s going on at Hockey-Graphs.com while also talking about the first week of NHL hockey and some of the biggest surprises of the year thus far.
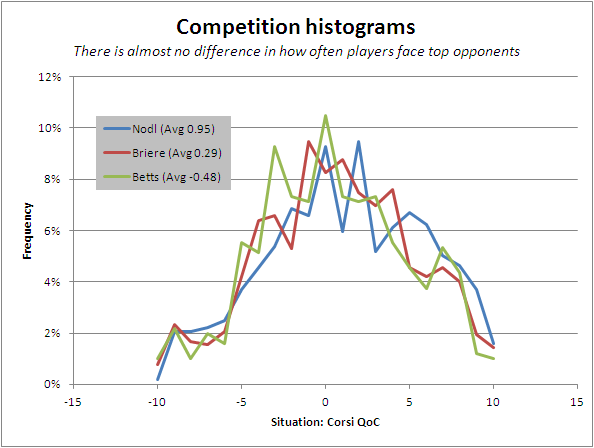
Competition Histograms by Eric Tulsky from NHL Numbers, Sep 23, 2012
ABSTRACT
We know that linemates have a larger impact on results than competition on the average. This has caused many to change player deployment chart axis from QoC to QoT metrics.
However, it’s not quite that simple.
The area of contextually nuanced studies with numbers like competition and teammate metrics is still well in its infancy. We have a general idea of what’s going on but there is a lot of information in the details.
We show here that a 1 percentage point change in teammate and competition Corsi% has an equal but opposite impact on observed output, but there are some differences. The distribution in the NHL is much smaller with competition. However, unlike with competition Corsi%, teammate Corsi% impact is not the same for all players.
We’re a day late, sorry. Just pretend you are listening to this yesterday!
Rhys and Garret update you on what’s going on at Hockey-Graphs.com while also previewing the season with some predictions for the new year.
Rhys Jessop and Garret Hohl talk about what’s new at Hockey-Graphs, the league’s new 3-on-3 overtime format, and Central Scoutings preseason release.
Rhys and Garret return for another season of the Hockey Graphs podcast. Come listen as they talk about the Penticton YoungStars tournament, preseason, and what’s new at the Hockey Graphs Website.
