
While there has been an increase in the type of data that’s available to us on prospects, we are still lacking across all developmental leagues. More importantly, and this is particularly true for the NCAA, player-level data still eludes us, even when there is team-level data present. To get at the context with which a player performs and the factors governing his or her environment, we are left with estimates of things like ice time and quality of competition/teammates.
While this hasn’t stopped us from making advances to enhance traditional scouting and prospect analysis, having player-level shot metrics would be a wonderful piece of data to have when evaluating their performance. This article will look at a method to predict those numbers.
Special thanks to DTMAboutHeart and Matt Cane for their feedback and guidance at certain steps in this process.
Recently, DTMAboutHeart and I published work on how much a player’s positional QoC & QoT can explain about their shot metrics. The numbers were encouraging and so this piece builds off of that previous work: “Can we use a player’s context to predict their shot differentials using estimated numbers at the NCAA level?”
First, we’d need to test it at the NHL level.
Using methods outlined in my NCAA piece on estimating these metrics for NCAA players, I applied that same process to NHL players. Since we’d only have estimated player data and team data to work with at lower levels, I used this as a constraint at the NHL level.
Below are the results using positional QoC/QoT as well as controlling for team effects for 382 forwards with at least 200 minutes at 5v5 play for the 2015-16 season.


And now the same thing for 215 defensemen with at least 200 minutes at 5v5.

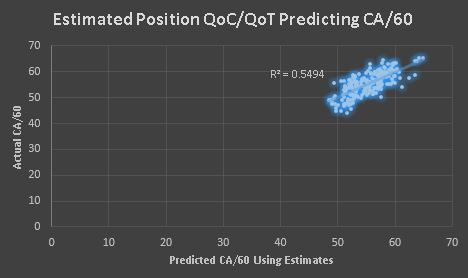
So, we see that using estimates does a fairly similar job at predicting shot rates as when DTM and I used the actual shot-based QoT/QoC metrics in our piece. In fact, using the actual shot-based QoC/QoT metrics only improved the Forward’s CF/60 numbers. Everything else was nearly the same.
What’s intriguing is that if you only include the team shot rates, both for and against, in the regression to explain a player’s on-ice shot generation and suppression, you get wildly different results.
Offensively, correlations drop significantly (to around 0.39), whereas defensively, it only drops a few points (though the residuals have much greater variance). Including this context boosts our understanding of how much a player creates offense versus how well they defend. I believe that team effects are more impactful when looking at defensive metrics — in fact, the coefficients in the regressions for offense and defense confirm this to an extent.
Why is this important? This tells us that this may be a viable method to estimating shot rates using estimates, which is all we really have for most developmental leagues. Of course, we’d need to test that on actual NCAA data.
Luckily, I was able to get my hands on player-level shot differentials for two NCAA teams from last season. I used a multi-linear regression using the estimated QoC/QoT metrics, controlled for the team’s shot rates for and against per game, and included estimated TOI/60.
I did the same thing without the TOI/60 variable and below are the results of the two models predicting shots for and against on a per game basis. These are R^2 values. There were twenty players on each team that played in at least half of their team’s games.

As you can see, there are differences based on the team. The models do over-estimate, one more than the other, the number of actual events occurring, but does so across the population, so I don’t think that’s a reason to dismiss it. If you add a few shots to everyone’s on-ice rates at the NHL level, it won’t change the order when it comes time to sort them based on who is best at shot generation and suppression.
Offensively, the models do pretty well, but there is a wider range for the defensive predictions. It’s a strange occurrence that the numbers are so much higher defensively when you include both teams, but the pace of one team’s play was significantly different than the other, so the correlations were artificially increased based on where the plots landed on the graph.
Below is a tableau showing estimates for both models on all NCAA players from the 2015-16 season.
2015 – 2016 Predicted 5v5 Shot Differentials for NCAA Players
A few notes: This is a work in progress and by no means a finished product. Also, testing the regression at the player level was done on all players as splitting by position would have yielded an even smaller sample to test upon.
If anyone out there has player-level shot metrics from an NCAA Division 1 team from the 2015-16 season and can share them for research purposes, I assure you the data will be kept private and anonymous. Having more data to test against is a way to further measure how accurate the models are.
Having addressed the limitations, I do believe that using these factors can offer a bit more context and insight into a player’s performance. I also believe research like this is a step forward and would be of assistance to a scouting department.
