
Late last week, Arik Parnass pointed out a particular peculiarity about the Ottawa Senators’ penalty killing so far this year.
For those that missed segment today on 690, #Sens PK is super interesting. Last in preventing goals, first in scoring them. PK GF% is 9th.
— Arik Parnass (@ArikParnass) March 18, 2016
While the Sens may be an extreme example, their numbers tell the story of a constant struggle that teams are faced with when killing a penalty: do you focus solely on your own end and do whatever it takes to prevent a goal, or do you allow your forwards to take the play to your opponents, trying for a shorthanded goal and forcing them to defend in a situation where they may not be expecting it.
This risk-reward question is one that’s central to the value of hockey analytics. It’s very easy to make decisions based on personal experience which is so often dominated by memories of things that are out of the ordinary – a coach will likely remember watching his winger get caught deep trying for a shorthanded goal, while forgetting the 2-on-1 opportunity he generated earlier in the game. It’s just as easy, however, for a fan to complain that his favourite team won’t put out their best forwards to aim for a go-ahead shorthanded goal without any data to back up their argument. The challenge for analysts then is to dig through the available data to figure out what past experience has taught us about the overall net impact of playing for a goal on the penalty kill, so that we can make an informed judgement as to what the potential costs and benefits are.
One way to test whether playing aggressively has a positive influence on a team’s shorthanded results is to look at what effect increasing shots for has on a team’s goal differential. The graph below shows each team’s seasonal PK goals for, goals against, and total goal differential per 60 plotted as a function of their Corsi For per 60 while shorthanded. If the traditional thinking holds true, we should see that increased aggressive play (represented by increased PK shots for) should lead to more goals scored and more goals allowed, with a limited effect on overall goal differential.
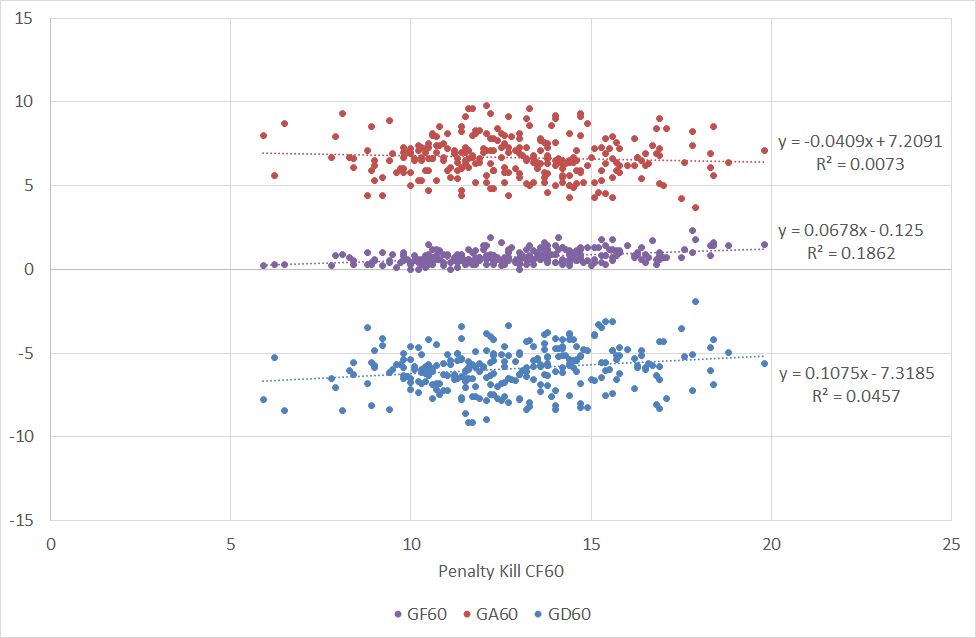
When we look at the data, however, we see a more nuanced story. We do see that increasing the number of shots you take while shorthanded generally results in more shorthanded goals for, just as we’d expect. We also see that increasing the number of shots taken while down a skater increases the number of goals allowed, but the relationship is a lot weaker than it is for goal scoring (in other words, we’re less sure that taking more shots while killing a penalty results in more goals against). And finally (and most importantly), increasing the number of shots you generate on the penalty kill ultimately tends to increase your goal differential modestly, although once again the relationship isn’t all that strong.
While this data lends credence to the idea that more aggressive penalty killing tactics can ultimately lead to better overall results, there’s a slight problem with our analysis. Because we’re only looking at each team’s total Corsi For rate on the PK, we can’t be sure whether the teams are actually playing more aggressively or if they’re just getting more opportunities because they’re better defensively. After all, a team that wins every PK faceoff and is able to pick-off more passes due to strong defensive positioning will get more penalty kill shots for without actually having to push forward and play a more offensively focused style.
Although a lack of granularity to dig deeper into what teams are doing on the ice is generally an insurmountable problem with the NHL’s current real-time scoring data, we do have other sources that give us a more detailed view of the game. One of those sources is the zone entry data that Corey Sznajder tracked for every team for the 2013-2014 season1. Snzajder tracked every time that a team attempted or tried to enter their opponent’s zone either by carrying, passing or dumping the puck in (although dump-ins where the team didn’t attempt to retrieve the puck were not included), providing an enormous amount of data to provide additional context for what we see in the NHL’s stats.
We can use Snzajder’s zone entry data to pick out all the times a team entered or attempted to enter their opponent’s zone with controlled possession while shorthanded, which should act as a proxy for how often they tried to drive the play forward and generate an offensive opportunity. We can then divide that total by the number of times that they allowed their opponents to enter their zone. This should give us an estimate of how frequently each team got the puck out of their zone2 and then attempted to pursue an offensive opportunity. We’ll call this stat a team’s PK Aggressiveness, which is calculated as:
PK Aggressiveness = (PK Controlled Entries For + PK Failed Entries For)/(PK Entries Against)
PK Aggressiveness is calculated as a percentage, and represents the fraction of the time that a team exited the zone on the powerplay and attempted to enter their opponent’s zone with possession3. Higher numbers mean a team was more aggressive and played for a shorthanded goal more frequently. The important thing to note though is that PK Aggressiveness is independent of a team’s defensive ability – since it’s measured against the estimated number of opportunities that a team had to play aggressively, it takes out any of the biases we would have seen in the Corsi data we initially looked at. Because of this, it should isolate any differences in tactics and allow us to test how those differences impact a team both offensively and defensively.
The first thing to note is that PK Aggression seems to vary pretty widely throughout the league. At the top end, teams like the Islanders and Jets attempted to carry the puck in for an offensive opportunity nearly 20% of the time in 2013-14, well above the league average of 14.8%. Down at the bottom, however, Dan Bylsma’s former employer, the Pittsburgh Penguins, and his new club, the Buffalo Sabres, appeared to focus more on keeping the puck out of their own net, attempting to carry into the zone only 7.9% and 10.1% of the time respectively. Each team’s PK Aggressiveness, as well as their goals for, against, and goal differential per 60 for the 2013-14 season are given in the table below.
| Team | PK Aggressiveness | PKGF60 | PKGA60 | PKGD60 |
| New York Islanders | 21.4% | 1.0 | 8.2 | -7.2 |
| Winnipeg Jets | 20.2% | 0.7 | 6.3 | -5.6 |
| Calgary Flames | 19.2% | 1.9 | 6.6 | -4.7 |
| Carolina Hurricanes | 19.1% | 1.8 | 6.6 | -4.8 |
| Ottawa Senators | 19.0% | 0.6 | 7.2 | -6.6 |
| Columbus Blue Jackets | 18.3% | 1.2 | 6.3 | -5.1 |
| Dallas Stars | 17.6% | 1.2 | 7.2 | -6 |
| Boston Bruins | 17.3% | 1.1 | 5.8 | -4.7 |
| Montreal Canadiens | 16.4% | 0.6 | 5.2 | -4.6 |
| New Jersey Devils | 16.3% | 0.9 | 4.4 | -3.5 |
| New York Rangers | 16.2% | 1.6 | 5.5 | -3.9 |
| Tampa Bay Lightning | 15.6% | 1.4 | 7.2 | -5.8 |
| San Jose Sharks | 15.3% | 1.3 | 5.6 | -4.3 |
| Florida Panthers | 15.0% | 1.2 | 9.1 | -7.9 |
| Vancouver Canucks | 14.7% | 0.7 | 5.8 | -5.1 |
| Los Angeles Kings | 13.3% | 0.8 | 6.1 | -5.3 |
| St. Louis Blues | 13.3% | 0.8 | 5 | -4.2 |
| Colorado Avalanche | 12.7% | 0.4 | 6.9 | -6.5 |
| Chicago Blackhawks | 12.2% | 1.2 | 7 | -5.8 |
| Detroit Red Wings | 12.2% | 0.4 | 6 | -5.6 |
| Washington Capitals | 12.2% | 0.5 | 6.6 | -6.1 |
| Anaheim Ducks | 12.2% | 1.4 | 6.6 | -5.2 |
| Toronto Maple Leafs | 11.8% | 0.8 | 7.9 | -7.1 |
| Edmonton Oilers | 11.7% | 0.4 | 6.5 | -6.1 |
| Philadelphia Flyers | 11.5% | 0.7 | 5.5 | -4.8 |
| Phoenix Coyotes | 11.4% | 0.4 | 8 | -7.6 |
| Minnesota Wild | 10.3% | 0.6 | 7.4 | -6.8 |
| Nashville Predators | 10.2% | 0.3 | 7.1 | -6.8 |
| Buffalo Sabres | 10.1% | 0.6 | 6.5 | -5.9 |
| Pittsburgh Penguins | 7.9% | 0.3 | 5.6 | -5.3 |
The general trend in this table is interesting to note, as it seems to mirror what we saw with the Corsi data from earlier: aggressive penalty kills tended to score more goals, but didn’t necessarily allow significantly more goals against, and in total saw a modest positive effect. This becomes even more clear though when we look at the correlations between PK aggressiveness and various goal and Corsi metrics.
| Metric | Correlation with PK Aggressiveness |
| GF60 | 0.57 |
| GA60 | 0.03 |
| GD60 | 0.21 |
| CF60 | 0.83 |
| CA60 | -0.33 |
| CD60 | 0.53 |
PK aggressiveness shows a strong positive relationship with both shot generation and goal scoring on the penalty kill. On the other hand, the relationship with goals allowed is basically non-existent, while the correlation with CA60 is actually negative (meaning being more aggressive actually results in fewer shots against). Regardless of which metric you look at, the results seem to be pretty clear: playing more aggressively on the penalty kill will generally result in better outcomes for teams.
What’s also really interesting (and maybe not surprising if you’ve read past zone entry work) is that PK aggressiveness seems to be a fairly consistent ability for teams – the split half correlation (our ability to predict results in half of a season using the results in the other half) for our single season of data is 0.77, which means that there doesn’t appear to be a lot of luck or randomness in our results. On the contrary, PK aggressiveness looks to be something that’s built into each team’s penalty killing strategy, .
While one season of data is obviously too little to draw sweeping conclusions from, it does appear that team’s may see better results the more they actively try to score on the penalty kill. Although the degree to which a team will be able to apply this will obviously depend on the personnel they have available, the data also suggests that the traditional “penalty kill specialist” may not be that useful of a role, particularly for forwards. Coaches should be looking for players who provide them with a legitimate offensive threat and not simply limiting their lineup choices to players who can win faceoffs and block shots. In the end, the goal in hockey is simply to finish the game with more goals than your opponent, and it certainly appears that on the penalty kill the best defense may actually be a good offense.
1If you’re unfamiliar with Corey’s work, there’s a good overview of the project here. If you’d like to support Corey’s project and purchase the whole season’s data, you can do so for $15 here.
2We use the opponent’s zone entries in this case for 2 reasons: 1) because dump-ins that aren’t pursued weren’t tracked, we’ll miss a lot of “opportunities” for the short-handed team to carry the puck-in; and 2) because their opponents will rarely dump-and-change on the powerplay, all of their attempts should be captured, and since each attempt by the powerplay team should, in theory, follow the puck being cleared by the shorthanded team, we should get a good sense of how often the penalty killing team had the “opportunity” to move the puck up the ice.
3While failed entries could technically be failed carries or failed dump-and-retrieve plays, the number of fails were so low that it was assumed they were all failed carries.

Really good work, Matt. I’ve long been a champion of playing aggressively on the penalty-kill and would do away with running out “good, defensive players” on the PK in favor of playing your most skilled forwards. A really interesting case study would be the 2011 – 2012 New Jersey Devils as they set a record on their PK (89.6%) and scored 15 goals, just one fewer than Ottawa has this season, yet gave up considerably fewer goals against (just 27 all season!).
Of course, rolling the likes of Zach Parise, Travis Zajac, Adam Henrique, and yes, even Ilya Kovalchuk out there at forward, it may be easier to play aggressively. Dave Barr was the coach in NJ at the time and ran the PK. The article link below is from their beat writer, Tom Gilutti, and the top players’ input on playing on the PK. Interesting that he’s in Buffalo now so it’ll be curious to see how they perform as they add talent to that team.
Anyways, great read and examining the penalty skill is definitely an area we haven’t spent much time on. Great work, as always, sir.
http://fireandice.northjersey.com/fire-ice-1.174987/devils-penalty-killers-on-the-verge-of-completing-a-record-breaking-season-1.93555
I don’t think going for offensive chances when shorthanded is equal to aggressiveness
A penalty kill can be aggressive without going for offense.
What you’ve analyzed is more like opportunism.