
Shot quality has been a topic of late on hockey twitter and various sites. Only a few weeks ago, the Hockey-Graphs Hockey Talk was centered around this topic. Shot quality is a lightning rod and much of the talking at or past one another that people often do stems from a single issue: there is no agreed-upon definition of what people mean when they say “shot quality.” Well, I like what our own Nick Mercadante had to say on the subject:
@77PGC and that’s where guys like @RK_Stimp and @Vallys_View come in with the tracking work. Give me a base repeatable skill to analyze.
— Nick Mercadante (@NMercad) January 17, 2016
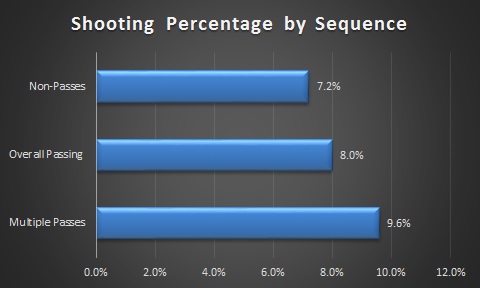
Establishing a base, repeatable skill that accounts for pre-shot movement and an increased likelihood of a goal being scored are what we need to properly analyze player contributions. Quantifying passing also gives us another actionable piece of data that everyone understands and coaches can use as well. Often, the simplest metric or method is the best. And, we should able to do that now that we’ve obtained a significant set of data. This chart may look familiar, but it’s essential to understanding how important passing is to goal-scoring. This is from all tracked passing sequences from the six teams (Chicago Blackhawks, Florida Panthers, New Jersey Devils, New York Islanders, New York Rangers, and Washington Capitals) that we tracked last season.
From this point on, I want you to forget whatever it is you think of when you hear the term, “shot quality.”
When I hear shot quality, I think we should be talking about any aspects of a shot that consistently increase the chance of a goal being scored. The reason we value Corsi and Scoring Chances is that they are both rather basic, repeatable, and predictive. What we are going to do in this post is examine the value in a single, repeatable metric that can tell us anything about what happens before the shot is taken. Specifically, we’re going to evaluate what we can learn from the shot assists a player generates.
For those unfamiliar with my work, I have been tracking passes, shot assists, and a whole bunch of other stuff over the last three seasons. Over the past two seasons, many people have joined me in this pursuit of better data to make better evaluations of players. Today, we can do just that. You can learn more about the project here and please reach out if you’d like to volunteer.
Let’s get into it, shall we? All data you will see is from 5v5 situations. We’re going to use the 72 forwards that played in at least 60 games for the 2013 – 2014 New Jersey Devils, and then the Chicago Blackhawks, Florida Panthers, New Jersey Devils, New York Islanders, New York Rangers, and Washington Capitals from the 2014 – 2015 season. I chose this number as I wanted a good enough sample from their respective seasons and playing at least 75% of the season seemed like a good place to start.
What we’re going to do is look at how well the rate at which a player assists on shots (makes the final pass before a shot) predicts their assists and primary points over the rest of the season (from their 1st game played to their 60th). To begin, we’ll look at the repeatability over the course of a season for both a player’s own shots (yes, I’m a Micah Blake McCurdy convert and have come to express shots as tantamount to shot attempts as it’s more intuitive) and those they assist on.
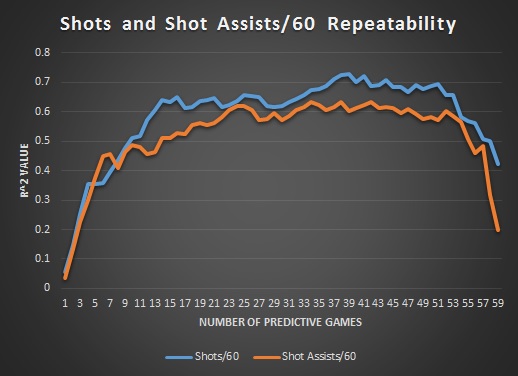
We see that the rate at which a player assists on shots closely follows the rate at which they shoot the puck themselves. Naturally, we would expect a player’s own shot rates to be slightly more repeatable as they have full control over that event. All of us have witnessed a player make a pass and expect another player to shoot, only to fumble the puck or take too long deciding. However, these are fairly close and we can identify that primary shot assists is a talent.
Next, we’ll combine a player’s shots and shot assists into one metric called Primary Shot Contributions. Due to the random nature of secondary point allocation in the NHL, most people tend to value a player’s Primary Points higher than their total points. As such, we will now look at the repeatability of a player’s Primary Shot Contributions/60 with the above chart.
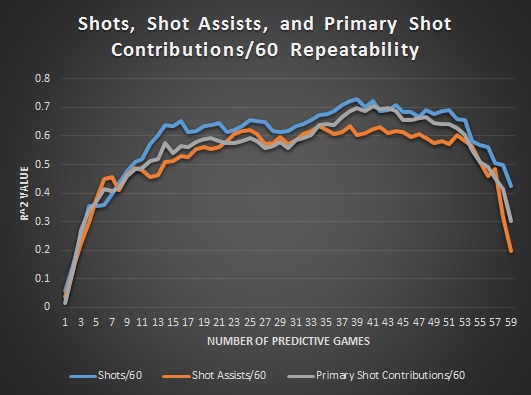
As logic would tell us, a player’s Primary Shot Contributions/60 follows the same pattern for repeatability as its two components do.
Now we will look at using a player’s Primary Shot Contributions and predicting their Primary Points over the course of a season.

This tells us that a player’s primary shot contributions (again, their own shots and those they set up for others as the final passer) can more accurately predict their primary points over the remainder of a season and can do so far, far quicker. In fact, you need only eleven games of data to find the strongest correlation between a player’s Primary Shot Contributions/60 (hereafter PSC/60), and how many Primary Points/60 (hereafter PrP/60) they’ll score over the rest of the season. A correlation, mind you, that is never that strong using PrP/60.
In short, if you want to know how many points a forward will score over the remainder of the season, you’re much better off using their Primary Shot Contributions than Primary Points. Points can be deceiving. Shot Contributions are more exact.
Next, we will take a look at the predictive aspects of a player’s own shots versus those he sets up for others. Some of you might be saying, “Well, how much of this predictive power is simply due to the shots a player takes? How much impact are his passes actually having? Which is more important?”

What we learn when we break down PSC/60 into its two components – Shots/60 and Shot Assists/60 – is that a player’s ability to set up others has a much stronger influence over the remaining number of primary points they will score than their own shooting does.
Lastly, we will look at predicting Primary Assist rates using PSC/60.
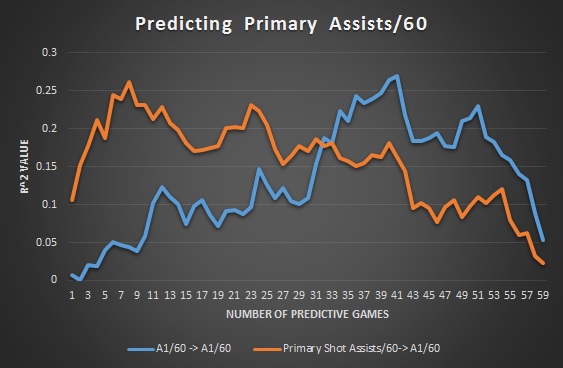
Again, we see how quickly we can predict the remaining Primary Assists a player will score over the course of a season. After only 8 games, the correlation is as its zenith (0.261) and you would need to wait until a player’s 41st game to find a stronger correlation using their A1/60 (0.269). At this point, the season is already half-over.
So What?
One of the aspects of hockey that has never been quantified is what is often referred to as “pre-shot movement.” What I’ve done here is accounted for one aspect of that by creating a rate metric of shot assists created by passes. Passing accounts for several things: sustained possession, pace and speed of play, particularly in the offensive zone, and an implication that the goalie is moving to track the puck and has to then get set. All of that is now contained in a repeatable and predictive metric that enhances player evaluation and surpasses existing goal metrics of Primary Points and Assists that may have been viewed as superior for predicting future goal involvement.
So, why is this important? In a nutshell:
- More accurately predict player points in a given season
- More accurately identify players that generate offense
- The ability for GMs to quickly evaluate talent in order to re-sign, trade, or waive accordingly
- Exploit market inefficiencies by investing wisely in players that can pass effectively
By tracking passes in the way that myself and many others have done, we have finally provided the hockey community with a baseline metric to account for shot quality. A baseline metric, mind you, that is both repeatable and predictive, two things that are essential if you want to convince people how to quantify and define shot quality.
Next Steps
Having established this baseline, the next step is to continue to test it as we accumulate more of our publicly available data. The goal is to complete the tracking of this entire season by the end of this year. Also, I’ll gradually include other aspects of what we track (one-timers, Royal Road passes, multiple passing sequences, etc.) to weight our events in the same fashion as existing expected goals models. Provided, of course, those are also repeatable and enhance what we already have. Certain events may sound important in theory, but ultimately become noise as the sample grows. This is the first step in cutting through the noise that is shot quality.

very cool stuff. I wonder why the predictability for Primary Assists peaks so soon in the season. I wonder if that peak will move further to the right over the course of the season, and smooth into a more traditional curve, when you add in more players/data.
It certainly could move to the right. I was surprised it peaked that early as well. As we finish teams for this season, I’ll add each one in and post the findings.
Good post. A few comments.
1. Your definition of shot quality is the correct one. Shot quality is anything that contributes to scoring goals above and beyond quantity.
2. Your first chart indicated multiple passes are important at boosting shooting percentage. This would indicate that there is value in the secondary assist. This is probably particularly true if the passes are occurring in the offensive zone.
3. I suspect another component in all of this is quickness of the play which is a bit more difficult to track. How quick you turn a pass into a shot or a subsequent pass could be a huge component of the shot quality equation. Unfortunately I am not sure how easily this will get captured with human tracking as even as little as a half a second could be a huge difference between the goalie getting across the crease to make a save and not. Tracking passes and puck movement certainly pushes the boundaries back though so good job.
4. The last chart is a little concerning for me. It basically says that with small sample sizes primary shot assists will predict future primary assists than primary assists do. This makes sense because shot assists will occur far more frequently than assists. What concerns me is that predictability seems to max out at ~8 games and it steadily declines from there and gets overtaken by primary assists at about the 33 game mark. That limits the value of the stat to just situations where we have G/60 vs G/60->G/60. I am curious to see if it would look similar to the last chart.
Good work though. Very interesting.
The quickness of the play and subsequent shot are certainly factors. We partially account for this by tracking one-timers versus all other shots. The time between passes would be nice to have, but it would take far longer to track.
I wonder if there may be some useful data hidden in secondary assists based on pass location too. Certainly a pass from the defensive zone that is successful on the other side of the opposing team’s redline would be meaningful if it led to a goal.
Really cool stuff! Apologies if I missed this somewhere — what is the exact difference between Overall Passing and Multiple Passes in the first graphic?
Overall passing is from all passes. So, a shot could come at the end of a single passing or multiple passing sequence. The Multiple Passing % is isolating shots from at least two passes only.