
“Mise au jeu BOS @ MTL Faceoff” by Fleurdelisé. Licensed under Creative Commons via Commons.
Over the summer, the NHL made a number of significant rule changes to make the game more entertaining to fans and more fair for teams, with 3-on-3 overtime being the most revolutionary and thus far the most applauded.
Buried down at the bottom of the list of rule changes, however, was a much less significant note. It involved faceoffs – you know, that thing data analysts get peeved at commentators for overemphasizing. For years, the standard procedure has been that the visiting team’s player is required to put his blade on the ice prior to his opponent. This is an advantage for the home player, as he can attempt to secure the puck back to his side with one consistent motion rather than having to move his stick forward and then backward.
For this season, however, in the interest of increasing scoring, the rule was changed such that it is the defensive player who is required to move first. You can see the fine print below.

So the question is, approximately 200 games into the 2015-2016 season, has this rule change had a tangible effect on scoring?
In order to answer that question, I compiled the overall faceoff winning percentage from the 2006 to 2015 seasons for teams in their offensive zone, comparing it to that number so far this year. Out of curiosity, I also found the percentages for home teams before and after the change. Let’s dive in.
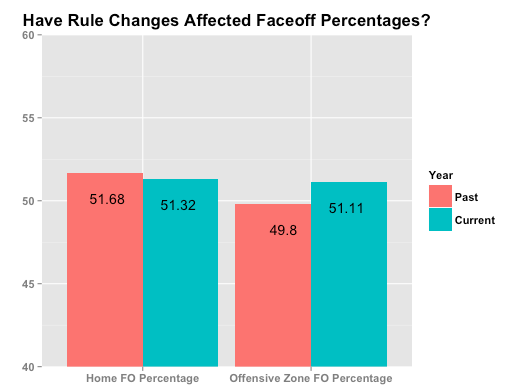
On the left, you can see that the faceoff percentage for home teams overall from 2006 to 2015 was 51.68 percent (on more than 740,000 faceoffs), and that has gone down only slightly this season to 51.32 percent (on about 13,000 attempts), not a significant enough change for one to be able to say with confidence that it isn’t the result of luck.
The offensive zone winning percentage change, however, is more noticeable. In past years, the offensive player won 49.8 percent of 485,000 non-neutral zone faceoffs*. It’s possible that over time that number would have approached 50 percent, but it’s also plausible that teams deploy slightly better faceoff men when in the defensive zone, or that the players deployed simply have more urgency when defending. Either way, that number has jumped to 51.11 percent this season on 8,000 draws, a statistically significant jump (p = 0.016 for stats-minded readers), indicating that there is more than luck at play there.
The final question, then, is if we know that the rule change has led to more offensive zone faceoff wins, has that impacted goal scoring, and if so by how much?
Back in 2011, Gabe Desjardins published this piece where he looked at how offensive zone faceoff wins impacted shot and goal rates. While much has changed since then, goal and shot rates have actually stayed fairly constant, only decreasing slightly** We will assume that shot rates following faceoffs haven’t changed too much either.
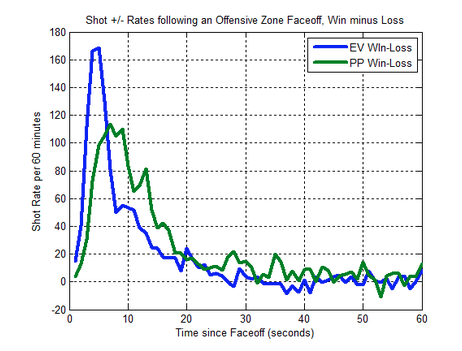
This chart from Gabe’s piece shows the differences between won and lost offensive zone faceoffs in terms of shots in the seconds following the draw. It is split by strength. By taking the area under these curves and multiplying it by league average shooting percentages at even-strength and on the power play, we can determine how many goals each won faceoff in the offensive zone adds on average.
So far this season, there have been 4453 offensive zone wins and 4259 such losses. If we contrast this an expected draws won – based on the percentage from past years – of 4339, it appears the rule change added 114 additional faceoff wins out of our overall sample of 8712. Since approximately 20 percent of game time is spent on the power play, we can use the shot rate and shooting percentage numbers from power plays for 23 of those draws (20 percent of 114), and those at even strength for the other 91.
In doing this, we find that those additional 114 faceoff wins on average lead to just over three goals. That’s it. Over 200 games, that averages out to about a goal every 67 games. If those numbers hold steady, over the course of the season the rule change will have led to an additional 20 goals. Overall, not a whole lot.
This finding actually aligns with what hockey analysis has found over the years when it comes to faceoffs. Overall, winning them just isn’t as important as it’s made out to be.
When we see a goal scored off a faceoff, it’s easy to attribute a large portion of that goal to that win. But just because the goal couldn’t have happened without the faceoff win, doesn’t mean the faceoff win was the determining factor in the goal going in. Consider that for every faceoff that results in a goal, dozens go by in which nothing comes of them. The importance of faceoffs over the course of a season is a fallacy, and for a league looking to increase scoring, the NHL will likely have to look elsewhere.
———————————
*I discounted neutral zone faceoffs because a) There is no way on the NHL’s play by play sheets to identify the offensive team and b) because the impact of teams winning more draws slightly closer to their offensive blue line is likely close to zero in terms of goal scoring.
**Goals per game has actually gone down from 2.73 last season to 2.65, but it is too early to tell whether that is due to more than simple variance, even though it reflects a generally downward trend of late.
