
Despite them accounting for approximately 20 percent of NHL game time, special teams have been largely ignored when it comes to analytics. Considering the data available and its small sample size compared to even-strength, that is somewhat understandable, and there have certainly been attempts to properly quantify and assess power plays. So what do we know so far?
Special teams data analysis began largely with the late Tore Purdy (aka JLikens), one of the earliest hockey analytics innovators. The earliest found statistics-based special teams article discusses score effects on penalty calls. Purdy finds a significant score effect, with the trailing team receiving more calls. While he investigates whether this is a result of the trailing team having more possession of the puck, he finds that the bigger impact is simply in referee bias, similar to home ice advantage. Referees call more penalties on trailing teams because of the referee equivalent of loss aversion. It is natural to want to keep things even as much as possible, both in terms of the penalty count and the scoreboard. Later, Patrick D. of Fear the Fin confirmed this effect with a more complicated model to predict power play opportunities for teams. There also appears to be a repeatable skill in terms of drawing penalties on both the team and player level, as illustrated by Eric Tulsky here. The Calgary Flames appear to be a team that can affect its expected results by drawing more penalties than its opponent, while Nazem Kadri is one of the NHL’s positive penalty differential kings.
There have also been efforts at analyzing special teams performance. Purdy penned several innovative pieces in 2010 and 2011 that took what we were learning about the importance of shot attempt differentials and tested them on both power play and penalty kill samples. He concluded that with samples of 40 games, the best predictor of power play success was Fenwick (or unblocked shot attempts) per 60 minutes. On the penalty kill, however, he discovered that save percentage (due to largely the same goalie manning the team’s net) was more repeatable, and thus that goals against per 60 was a decent measure. The next year, Gabe Desjardins looked at how to appropriately regress power play results considering their small sample sizes, and backed up Purdy’s claims that shot rates were most predictive on the power play. Soon after, while discussing his Philadelphia Flyers, Tulsky did the same. Then, in 2013, Patrick D. took the analysis to the next step and looked at ten game intervals of prediction, among other interesting tests. He also found Fenwick to be most predictive on the power play, while combining Corsi against with goaltender performance yielded the best model performance for the penalty kill.
Considering it has been three years since that last study was performed, however — and we’ve gone through another lockout, yet another Chicago Blackhawks cup win, and even an John Scott all-star game appearance (well I guess not quite yet) since then — I felt it was time to update those results.
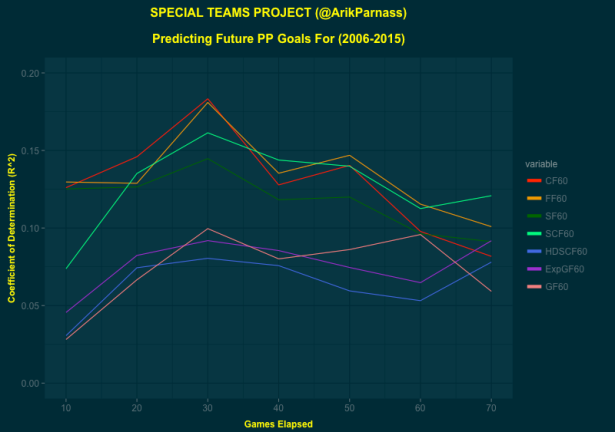
Since most of my project will focus on the power play, I looked at how predictive Corsi, Fenwick, Shots on Goal, Scoring Chances, High Danger Scoring Chances, the War-On-Ice version of Exp. GF, and Goals are (all per 60 minutes, and thanks to War-On-Ice and nhlscrapr for the data) for the man advantage.

That chart features data since the last lockout, but after some power play analysis I did last year, I wanted to take a look at exclusively the last couple of years, because something looked fishy.

Unfortunately, since last look, our ability to effectively evaluate a power play using play-by-play data has taken a hit. It’s possible that this is just random variance, and that next year we’ll see a spike in predictive abilities, but until then, the jury is out on what to do with our data. It’s difficult to be too confident in anything we have.
Fortunately, analysts have made inroads into analyzing some of the more specific aspects of power play performance. In 2011, Desjardins did a great job in quantifying the value of a power play faceoff win, something I looked at recently in reference to a John Tortorella question as well.
Matt Cane discovered that teams should be using four forwards on the power play more than they are, a growing trend it seems and something that should continue to expand.
Eric Tulsky drew a fascinating conclusion from limited zone entry data about entering the offensive zone on the power play, finding that dump-ins, relative to even strength, are more beneficial than one would think because of the extra man’s utility in recovering the puck. That doesn’t necessarily mean that teams should dump the puck in more on the power play, just that it’s not as damaging in the aggregate, at least in terms of shot attempts, than at even strength.
Patrick Holden looked at the Washington Capitals and discovered on the other hand that controlled entries were a key to their success, and that the team struggled when forced to dump the puck in too much with the extra man. So results are mixed.
For the 2015-2016 season, I have been closely tracking power plays for the Capitals, Flyers, Tampa Bay Lightning, New York Islanders, Montreal Canadiens and Toronto Maple Leafs. I will be diving deeply into zone entry data, among other micro-stats, and will attempt to find ways to better evaluate and predict power play success under seemingly variance-dominated conditions. Follow along at www.nhlspecialteams.com and on Twitter @ArikParnass.

Phew, does that second chart look bad…