
With Todd Richards being let go after a disastrous 0-7 start by the Blue Jackets, and Bruce Boudreau on the hot seat (heck, he might be out of a job by the time I finish writing this), coaching is once again in the spotlight. After Richards was fired, I went on a mini rant about how I believe having a good GM is more important than having a good coach, and while I still believe this is true, I wouldn’t be a data person unless I tried to prove it.
This project has many parts to it. The first, which I’ll be doing here, is just looking at the breakdown of Scoring Chances For% compared to Coaches and GMs in the early days of their tenure, i.e. right after being hired. Scoring Chances, to simplify things, are basically “more dangerous shots” (click here for a more rigorous definition).
To start, I needed data. I pulled all 30 teams from 2006/07 to 2015/16, and coded each season by what kind of organizational changes happened within. This gave me 331 data points, as there were often midseason coaching or GM hirings to account for.
The states broke down like this:
1) No Change – 64%
2) Hired a new Coach – 21.5%
3) Hired a new GM – 7.3%
4) Hired a new Coach & new GM – 7.3%
In looking at the data, some patterns quickly emerged. The first two years of tenure in either role were where the most change, for better or worse, happened.
Because I had so much data in the No Change category, I wanted to see if there was any sort of trend year over year for the control group.
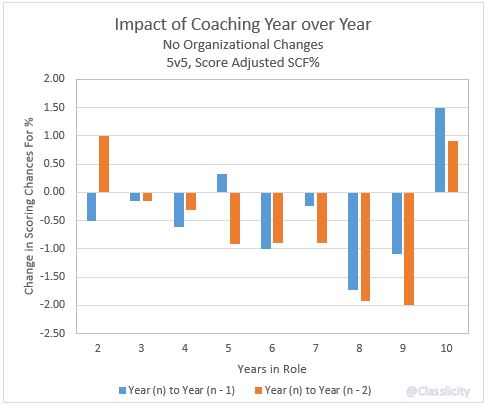
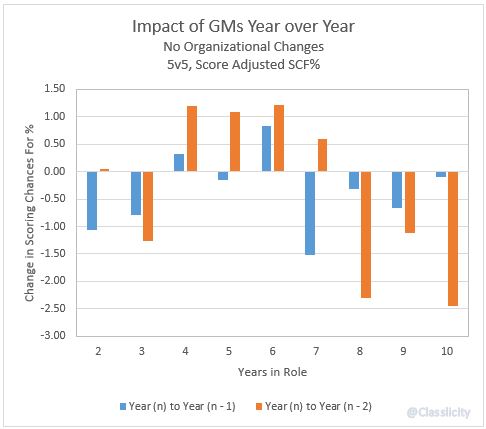
As you can see, with no new GMs coming into an organization, coaches have a very difficult time improving a team’s SCF% year over year, whereas the GMs have a sharp uptick in years 4 through 6, and then dip back down after that. Likely a lot of this is spurred by roster turnover, so I looked at that as well.
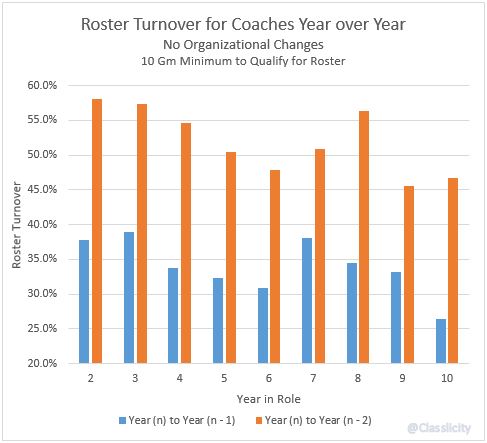

Unsurprisingly, the coaches had on average 2% less roster turnover for each (n-2) than the GMs. This makes sense, because technically it’s not the coach’s job to set a roster. The GMs also had the highest turnover in year 2 and 3, which can explain why their uptick in SCF% doesn’t happen until year 4 as it might take a year or two for the team to gel.
Now before you get too caught up in roster turnover, there’s literally zero correlation between Roster Turnover and change in Scoring Chances year over year. 2 year turnover vs 2 year change in SCF% is an r^2 of only 0.0004, which in large part means that GMs still don’t have a good handle on what drives Scoring Chances. (Side note: if you narrow the sample to just the past three full seasons, the r^2 jumps to 0.0138, suggesting that the Fancy Stats Revolution may in fact be having an impact on these roster decisions, or…it could just be a small sample size.)
The only thing that Roster Turnover does correlate with, even loosely, is the SCF% year prior to sample (Year 0), with an r^2 = 0.0793; a low SCF% means a team has a high turnover the next year, a high SCF% means low turnover. This makes sense – pretty much every fan can tell when something isn’t working on a team, but it’s a lot harder to identify the problems and then attempt to fix them.
Which brings us back to isolating the usefulness of firing coaches. Now that we know the range of roster turnover, we can see if that actually does impact the success of coaches in their early years.
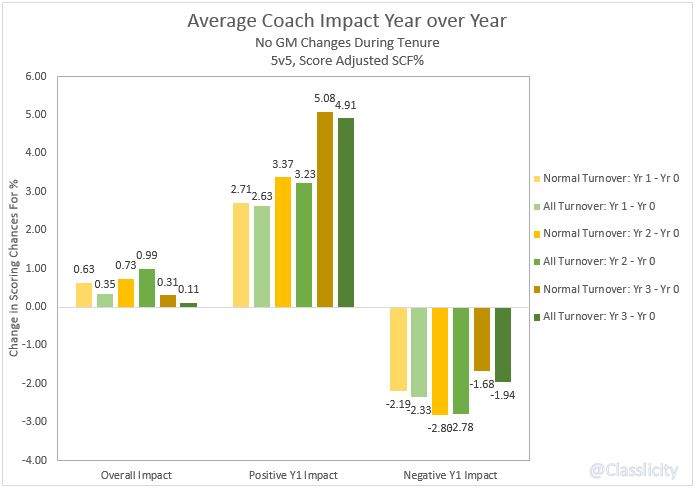
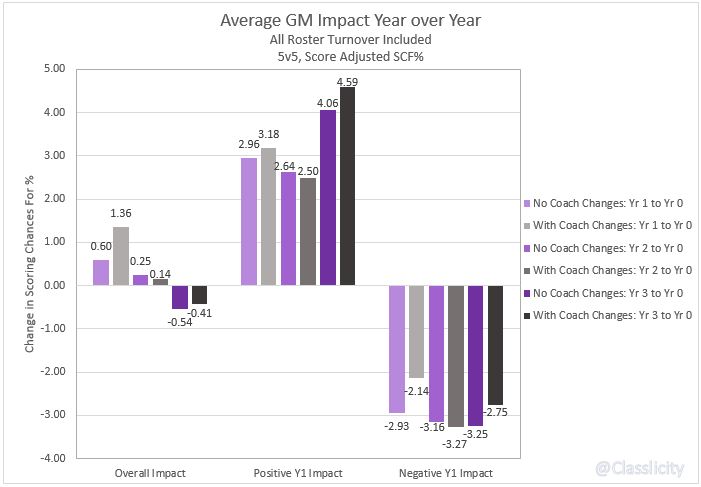
This graph attempts to isolate Coach impact as much as possible by only looking at the 21.5% of the sample that did not have any new GMs as well. As you can see, overall, the impact is very small in general, and gets lower each year, regardless of roster turnover.
However, it appears that a good coach in Year One will continue to improve the team, whereas a coach that drags the team down in Year One will keep doing that throughout their tenure. Roster turnover pulls both Positive and Negative values closer to zero, but not enough to be significant. In fact, there is a sharp uptick in Year 2, in large part because that’s when the effects of the “New GM/New Coach” category will be felt.
Unfortunately, in this sample about 54% of coaches landed in the Positive camp, and 46% were in the Negative category. This probably isn’t very heartening news for Columbus or Anaheim fans.
This is a similar chart for GMs, except this time we’re looking at the effects of hiring a new coach during the early days of their tenure. As you can see, during the first year, it’s extremely beneficial to have a new coach, however, that impact decreases in both year 2 and year 3.
The same effect was seen on GMs as coaches; whatever impact they had in the first year was still likely to be their impact in the second year, regardless of coaching changes. While there was a much smaller sample of GMs than coaches, the good news is that the split between positive and negative was a lot more definitive for regardless of coaching changes. About 65% of GMs landed in the Positive category.

With all organizational changes controlled as much as possible (no new hires, only average roster turnover), we can take a look at the most isolated effects of change. In general, both Coaches and GMs see the same overall uptick in year one, though the splits are where this chart becomes more interesting.
All else held equal, a good Coach will outperform a good GM.
A bad GM will be worse than a bad Coach in the long run.
However, part of this is mitigated by realizing that 66% of coaches in this sample were hired within the first 3 years of a GM’s tenure, so “all else held equal” isn’t very applicable. More important is this: the first year of a coach or GM’s tenure will set the tone for improvement or decline in that team’s Scoring Chances and if you aren’t seeing improvement by year 2, you likely won’t see improvement.
To put this into practice, we can now categorize coaches & GMs with at least two years of experience. (Strongly recommend you right click + open image in new tab for these next two graphs.)
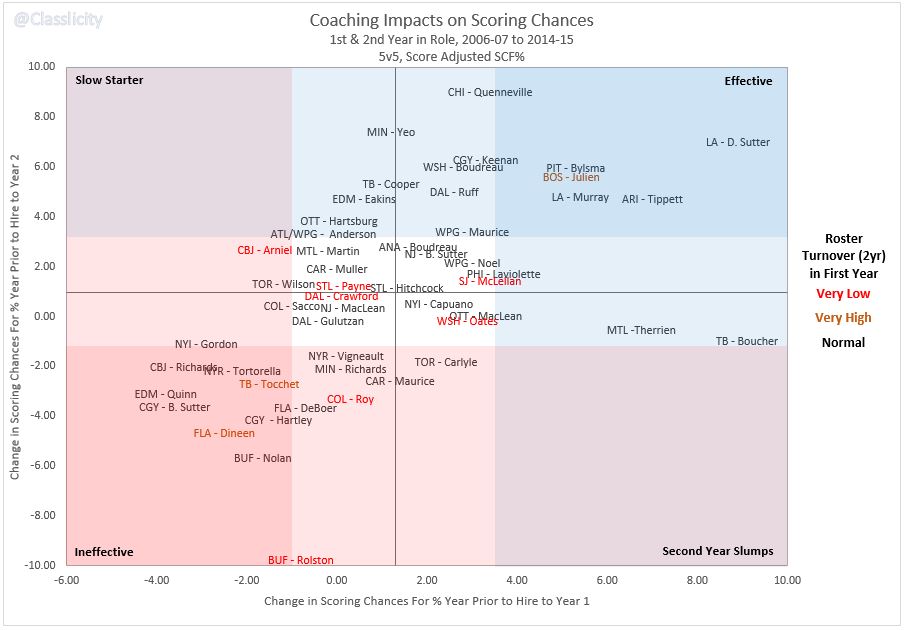

Now, these do have to be taken with a grain of salt, because there are a lot of variables that aren’t controlled for here. For instance, Quenneville got the benefit of a pair of talented players who conveniently started playing for the club his first year coaching. Bowman joined the organization the next year, turning over the roster once (68% 2yr turnover that year), and then letting it ride until 2011.
Roy, who is my current favorite punching bag, had unusually low turnover his first year coaching, but then jumped into the normal range the next year, when Sakic was hired as GM. However, Sakic has eschewed turning over the roster again, with strangely low 2yr turnover of 50% this offseason. This suggests to me that Roy probably had more influence over the current roster than the GM.
Ted Nolan…well…we all know what went on there. Rolston, on the other hand, worked for the Sabres pre-tank. He was just bad.
Yzerman might have had a slump in Year 2, but that was more than corrected with the hire of John Cooper. The Lightning abruptly jumped into the positives in Cooper’s 2nd year as coach, prompting a second round of high roster turnover, leading to the team challenging for the Stanley Cup last year.
In my sample, 75% of coaches and 67% of GMs mirrored their Year 1 results in Year 2 (increasing or decreasing SCF%). For those outliers, only 23% of coaches and 33% of GMs had very high or low roster turnover.
To really get to the bottom of the issues, you have to look at things at an organizational level, which I’ll be doing for a series on Today’s Slapshot. There is also a fairly pronounced “effectiveness” curve for GMs and Coaches I’ll be exploring.
For now, remember that a coach can only do so much without a GM bringing in a talented cast.

Interesting the Fletcher falls into the “inneffective” category considering how bad the Wild org was before him.