
And now I’m doing a post about it.
Yesterday, I tweeted a poll:
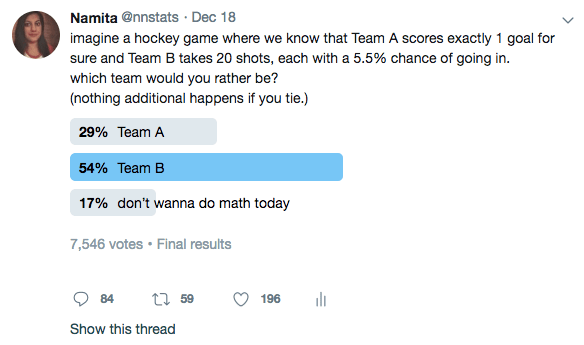
First of all, I’m impressed that only 17% of people said they didn’t want to do math today. Secondly, many of you did get the answer perfectly correct, with the same formulas I’m writing below and/or some fun simulation results. You guys are a credit to yourselves and your AP Stats teachers. Thirdly, I tweeted this question so I could get on my soapbox about 2 things as they relate to sports stats, namely:
- looking at the right outcome variable
- dealing in distributions rather than averages
Before I go any further, the takeaway here is that Team A wins more often. Read on to see how to arrive at that answer.
So, how do we begin to approach this? A simple expected value framework would state that Team A’s expected goals = 1, whereas Team’s B’s expected goals = # of shots * P(goal) = 20 * 0.055 = 1.1. 1.1 goals > 1 goal, so Team B is better off.
But that’s not really what we care about! We’d like to know the probability that each team wins the game. [Note: Some of you wanted to get pedantic on me and say that you’d cheer for Team B regardless of the math because it’s more exciting. So I will return the pedantry and say that I did not specify how Team A is scoring that goal, and it could very well be the most exciting hockey you’ve ever seen.]
For Team A to win, Team B has to score 0 goals on 20 shots. The probability of that happening, assuming the shots are independent, is P(no goal) multiplied by itself 20 times, or (1 – 0.055)^20. Therefore, P(Team A wins) = 0.32258, or about 32%.
For the teams to tie, Team B has to score exactly 1 goal. This is where it’s helpful to look up how the binomial distribution works, but I’ll power through this explanation assuming you haven’t.
Let’s say Team B only scores on their first shot, and then misses all the others. The probability of this exact sequence happening is P(goal) * P(no goal)^19 = 0.055 * 0.945^19 = 0.018774.
O X X X X X X X X X X X X X X X X X X X X
This is equivalent to the probability of only scoring on your 2nd, or 3rd, or 4th shot.
X O X X X X X X X X X X X X X X X X X X X
X X O X X X X X X X X X X X X X X X X X X
X X X O X X X X X X X X X X X X X X X X X
etc.
And there are 20 possible ways for you to only score on your nth shot, so P(tie) = 20 * 0.055 * 0.945^19 = 0.37549.
Finally, P(Team B wins) is just 1 – P(Team A wins) – P(tie) since Team B wins if they score 2+ goals and there are no other outcomes. Which means P(Team B wins) = 0.30193.
So it’s very close, but Team A wins slightly more often (32% vs. 30%), even though Team B is expected to score more on average (by 0.1 goals per game). Obviously, that isn’t a huge discrepancy, but the point I wanted to make is this: try to look at distributions whenever you can, because averages may not tell the whole story.
Friend of the site Danny Page wrote about some similar ideas in soccer, so be sure to check that out as well!

I won’t question your math, and simply assume it is correct, and I get that you were attempting to make a specific point, HOWEVER, I would say that your premise is flawed, or at least I would guess that your premise is flawed.
I would be interested to know how often a team wins 1-0 in the NHL. My guess is that it is a very low frequency. So with that in mind, if you had a team that never scored more than 1 goal, they likely aren’t going to win many games. So sure, mythical team A beats mythical team B, but mythical team A isn’t going to beat very many real world teams, hence my statement that the premise is flawed, as it relies on two non-existent teams, that will most likely never come close to existing. The lowest GF/G in the NHL right now is LA with 2.23, the lowest average shots per game is Anaheim with 26.8. Carolina comes close to Team B with a 5.65 shooting percentage, but they are taking 37.4 shots per game, not 20.
Swing and a miss.
Who, me or the author?
I’m sorry to say Ken, but it’s you.
For the record, I’m not trying to be a dick or anything. Just looking to have a discussion. I just think that his point could have been better made with some real world examples. As it is, he used fictional examples which have no basis in reality. No team only scores 1 goal a game, or even comes remotely close to averaging that (yeah, I know, “averages may not tell the whole story”), and only one team, which is an extreme outlier this year, has a shooting percentage around 5.5%.
I think if he had found some real stats that demonstrated his point, anonymized them, and asked the same question, it would have been more impactful.
https://yourlogicalfallacyis.com/strawman Your first paragraph admits as much. “You are correct, but let me tell you how you are incorrect. About a different thing”
Congrats on being literally the worst type of internet commenter.
Wow, that escalated quickly, I mean, that really got out of hand.
At the end of the day, I love hockey stats, but I see their use as a point of trying to explain the real world results, and (hopefully) predict to some degree of accuracy, future results. I don’t think this article did any of that, as the example cases aren’t based in any sort of reality. It is simply a discussion of how statistics (in general, not specific to hockey) work, rather than how they actually apply to the real world.
In other words, his point of “try to look at distributions whenever you can, because averages may not tell the whole story” would have had more impact if he used real world examples, as opposed to two hypothetical examples that seemingly have no basis in reality.
I would have thought this would be obvious, but this is meant to be a starting point to explain the concept. I’m also confused about how hard you leaned in to the “he” bit considering that the author of this is not a man.
I posted an apology below for my error with the author’s gender. It was an egregious oversight on my part.
As for starting point to explain the concept, that’s fine, and fair. I would think the author would see it as a starting point to engage in discussion.
I feel like the bulk of the responses I have received here can be essentially summed up with: “thou shalt not have a contrary, or critical view. Thou must read the article and remain silent”.
I believe “he” is actually “she” in the real world.
I had no problem understanding the Twitter problem as presented – a stats question using an accessible scenario. It wasn’t about hockey, it was about binomial distribution vs. mean.
Zoikes, my sincerest apologies on the he/she topic. That’s a big miss on my part.
I agree that it wasn’t about hockey, though, you can see how a person might get there with the question using a hockey example and this article being on a site called “Hockey Graphs”. 😉
Again, my only point, however (admittedly) misplaced it might be, is that the discussion loses something when the examples given don’t really resemble anything that someone might encounter in the real world. This is easily demonstrable by using a shooting percentage that is more realistic, such as 8%. Team B then wins ~48% of the time. Even more realistic, 8% shooting percentage, and 30 shots a game, and Team B wins ~76% of the time.
So my point is that a poor example was used, as it doesn’t really make the point that you need to look at distributions, because when you start looking at real world values, the whole argument starts to fall apart.
I enjoyed the article. It’s a good demonstration of examining probabilities via distributions, which is a more appropriate means of calculating win probability. However, I didn’t enjoy reading the comment section.
Ken seemed genuine with his concerns, and resorting to insults is not a good way to respond to such concerns (even if said concerns are based in fallacy). The point of these articles, to my knowledge, is to educate, not belittle. Ken can take it, at least. Most folks, on the other hand, will raise their defenses and ignore everything you say afterwards, even if what you say is correct. Plus, statistics is not an easy field to grasp, which will lead to a lot of misunderstandings.
I guess the gist of what I’m saying is this: Please be more understanding. Not every critic is raising such concerns out of spite. Many just want to learn and grasp the concepts further.
Cheers!
if real match stats can be used to explain these formulas on win probability then it would make sense whether it was accurate. For instance pick a stats from 2017 and compare with 2018 – You have the actual result of those games. By using those formula we would know how accurate these probabilities are!.