
“They don’t ask how. They ask how many.”
-Hockey Proverb
“But seriously though… how?”
-Me
To state the obvious: goal-scoring is an essential skill for a hockey team. Players have made long careers by putting the puck in the net.
But how do players create goals? Skaters rely on all sorts of skills to score; some are fast, some have a huge shot, and some know how to be in the right place for an easy tap-in. But we don’t have a rigorous view of what those skills are, how they fit together, and which players rely on which ones.
In this piece, I take 100 of the top NHL goal-scorers and apply unsupervised learning techniques to group them into specific goal scoring types. The result is a classification that buckets the scorers into 5 categories: bombers, rushers, chance makers, chaos makers, and physical forces. These can help players understand how to apply their skill set to goalscoring. It can also help teams make sure that their system is putting their top players in a position to score.
This type of work has precedent. Clustering methods have been used by Ryan Stimson to group players’ overall style and by myself (less rigorously) previously to describe neutral zone play. Most relevant was the 2015 RIT Hockey Analytics Conference presentation by Jen Lute Costella on findings from manually tracking goals. That presentation included grouping players into three categories, based heavily on zone time and goals-to-assists ratio: all-around, DIYers, and finishers. I’m aiming to do something similar, but I’ll add additional rigor around how many groups are made and how they are defined. In addition, I’m using a more extensive dataset that’s already publicly available, making it more accessible to all.
The Data
I selected 100 top goal scorers by ranking all forwards on goals per game (5v5 or PP) from 2013 to 2018 with a minimum of 20 such goals. It’s an arbitrary system, but the list is a reasonable approximation for the top scorers in the NHL. To cluster their goal scoring style, I collected data points from three sources:
Corsica Summary Statistics, 5v5 unless otherwise noted (Thank you, Manny Perry)
- Shooting Percentage
- Corsi For per 60
- Penalties Drawn per 60
- Takeaways per 60
- Hits per 60
- Powerplay Shooting Percentage
- Ratio of 5v5 to Powerplay Goals
Play by Play Information from Goals (Thank you, Manny Perry and Evolving Wild)
- Average Assists per Goal Scored by Player
- Share of Goals Scored on Rush Shots
- Share of Goals Scored on Rebounds
- Average Distance from Net for Goals
- Standard Deviation of Distance from Net for Goals
- Share of Goals Scored by Shot Type: Backhand, Deflected, Slap, Snap, Tip-In, and Wrist
Neutral Zone Statistics (Thank you, Corey Sznajder)
- Controlled Entry Percentage
All of these inputs are scaled, so we’re evaluating these players on how far they are from the average within the group. I then performed principal component analysis, which combines the variables to reduce how many we’re dealing with while keeping as much information as possible. In this case, I recombined the data so that we have a total of 15 variables to work with.
Next, I ran hierarchical clustering. This process determines how similar each player is to every other player in the selected stats. By grouping the players that are most similar, this clustering can tell us how to best sort all 100 players into any number of groups from 1 to 100. Most importantly to us, it tells us how similar each group is from one another, which helps figure out how many groups is a natural split. In our case, hierarchical clustering showed that there were five natural groups of players in the data
Finally, these five clusters were finalized with k-means. K-means is similar to hierarchical clustering but takes more of a top-down approach. This can lead it to better groupings, but we need to tell it how many groups to divide the data into. Since we know from the hierarchical clustering to use five, we can plug that in to get the final player groups. For more details on this process, check the appendix at the bottom of this post (and the linked code)
The Clusters
So what do these five goal-scoring styles look like? The clustering analysis shows which characteristics are most distinctive for each group. I interpreted those results to describe the 5 groups as follows:
Bombers
- Total Players: 18
- Key characteristics: Bombs away! These players score from much further away from the net than most other forwards, beating goalies with slap shots or wrist shots. They tend not to hit and don’t score goals on the types of shots that come from getting close to the net (rebounds, backhands, deflections, and tips)
- Most representative players: James Neal, Kyle Turris, Brandon Pirri, Filip Forsberg, Vladimir Tarasenko
- Other notable players: Steven Stamkos, Phil Kessel, Patrik Laine
Rushers
- Total Players: 19
- Key characteristics: Similar to Lute Costella’s DIY group, these players steal the puck, get rush chances, and score unassisted on backhands and snapshots
- Most representative players: Gustav Nyquist, Tomas Tatar, Jeff Skinner, Mark Scheifele, Rick Nash
- Other notable players: Connor McDavid, Auston Matthews, Evgeni Malkin, John Tavares, Taylor Hall
Chance Makers
- Total Players: 25
- Key characteristics: These players have a high shooting percentage, either because they have a great wrist shot or because their goals come after several passes, leading to higher quality opportunities. They don’t score on the rush, so presumably, they cycle and create openings over time. They score from close to the net and rarely elsewhere
- Most representative players: Patrick Kane, Jaden Schwartz, Alex Galchenyuk, Jordan Eberle, Nikita Kucherov
- Other notable players: Anze Kopitar, Jamie Benn, Johnny Gaudreau, Sidney Crosby
Chaos Markers
- Total Players: 24
- Key characteristics: These players thrive on plays that look like “lucky bounces”, scoring on deflections from all over the ice. They tend not to carry the puck and have low shooting percentages, relying on volume to get the right bounce
- Most representative players: Craig Smith, Kyle Okposo, Tyler Seguin, Patrice Bergeron, Cam Atkinson
- Other notable players: Anders Lee, Blake Wheeler, Brandon Saad, Zach Parise
Physical Forces
- Total Players: 14
- Key characteristics: These players are in the way. They hit, draw penalties, and score on tip-ins and rebounds. They’re particularly dangerous on the powerplay but don’t often carry the puck
- Most representative players: Scott Hartnell, Nick Foligno, Patric Hornqvist, Wayne Simmonds, Chris Kunitz
- Other notable players: Alex Ovechkin, Nazem Kadri, Brayden Schenn
None of these groups is necessarily better or worse than another. So how exactly do they compare? Here are their averages in each of the stats used to define them:

Note that the “most representative players” are not the best players in the group or the most special, just the ones that end up most embodying that particular group for all its strengths and weaknesses. Other players could easily be on the borderline between two groups. In addition, it’s worth noting that at a glance, players from the same team seem to be appearing in the same group more often than I’d have expected. This could be because the team has a particular style, or reflect biases from the area data collection on decisions like shot location and type.
How should this be used? In a few ways. First, players can ask which type matches their skillset and model their game after the players that appear in it. Since this analysis looks at the most successful goal scorers in the world, they can guide others on what skill combinations work. For example, a physical player looking to contribute more offensively could develop their skill with tip-ins and gathering rebounds, as that’s how the “physical forces” score. In addition, coaching staffs can see where their top players fall and make sure that their system is conducive to them. For example, rushers need the green light to create their own opportunities, while chance makers will probably benefit from working with linemates in a system that establishes zone time.
Conclusion
There is plenty more that can be done with this type of work. Others may have different ideas for which players to evaluate or what data to include. For example, an earlier draft of this work used different player criteria, and it consistently formed a cluster of three players who were quite distinct from all other scorers: Michael Grabner, Carl Hagelin, and Andrew Cogliano. These players were grouped because they tend to score without getting powerplay time, and they do so with high-end speed.
Of course, plenty of people are primarily interested in where their favorite player falls. Here’s a list of all players in the study and which cluster they were placed in. You can find all of the stats used for these players on Dropbox.

Appendix: Methodology Details
Data: Corsica summary data is aggregated from 2013-2014 to 2017-2018, all regular season. Play by play data is regular season 5v5 from 2013-2014 to 2016-2017. Rush and rebound shots are based on the Corsica definition here. Neutral zone data is everything Corey Sznajder has tracked from 2016 – 2018 as of 12/12/2017. This covers most of the 2016-2017 season and some of the 2017-2018 season. For 3 players without data in this timeframe (Pavel Datsyuk, Erik Cole, and Martin St. Louis), I used their data from Sznajder’s 2013-2014 tracking project.
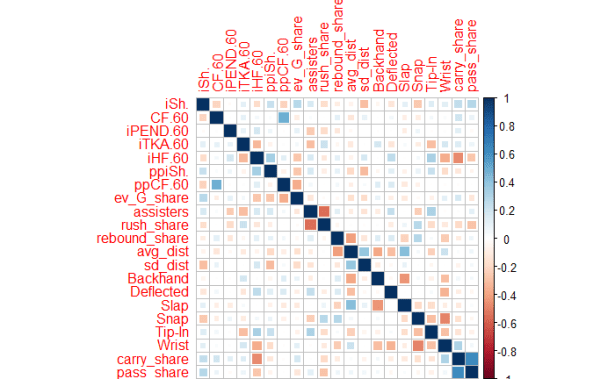
Originally, the dataset also included powerplay Corsi For per 60 and split controlled entry percentage into carry-ins and pass-ins. These were modified after reviewing the correlation plot, which showed that PPCF/60 was closely correlated with the 5v5 version, and carry-ins and pass-ins were closely correlated to one another. That correlation plot is shown below.
With this dataset, I performed principal component analysis (PCA) to reduce the dimensionality while maintaining the most important information. There was no clear cutoff point for how many principal components to include (see the plot below). I therefore used 15, and this explains 95% of the variance. I repeated the analysis with 10 principal components (explaining 80% of the variance) and got equivalent results.

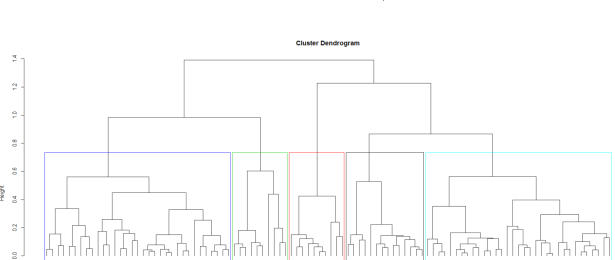
With the principal components prepared, I performed hierarchical clustering to see how many clusters to divide the players into. As seen in the initial hierarchical tree below, the most natural cutoff point appeared to be five clusters. These clusters were then finalized by consolidating the data using k-means. The code for this work is available on Dropbox. Some raw data is withheld due to size limitations, but I will be happy to share it on request.

Just to make sure I understand correctly, the nature of the clustering scheme was unsupervised correct? If so, this is really remarkable. The players in each of the categories actually appear to be relatively similar to how someone might group them ad-hoc based on playing style. Very interesting analysis. I have actually thought to do this for some time and use it to analyze which players are on the most friendly contracts based on other players in their “cluster.” Or generally using cluster analysis to determine value of a player to a team etc..
Yup, all of this is unsupervised. I’m glad you feel the categories feel natural, as I was worried people would object to a few star players in odd spots. There’s definitely a lot more that could be done with cluster analysis
Were there any players in this group that had no strong association to a particular centroid or straddled enough boundaries that they could be considered “versatile?” I know you could theoretically make a sixth group but there’s no guarantee that it would be that cluster.
I wish I had a better answer, but the downside to the statistical package I used is it does not have particularly easy ways to extract this info. It would definitely be worth knowing, and I’m going to keep poking into it to see if I can answer without a mountain of work
Alex, this is great work – curious if there is additional insight that could be gained from crossing this with coaching style or system. For example, how does coaching style or system impact players (if they have been in multiple situations). What coaching styles fit with what type of player – that sort of thing. Anyway, really interesting work and looking forward to reading more.
Thanks! I can speculate on how to coach each type, though I don’t have data to back it up. Bombers I’d try to set up with someone who can feed them one-timers or other shooting chances, and would forgive them for not going to dirty areas if they put up results.
Rushers need the freedom to break from the defensive zone. They can produce with less talented linemates, but I’d try to get them a defenseman who can throw them outlet passes. I’d also try them on the PK.
Chance Makers are often the most skilled guys; I’d want them with linemates who can stickhandle/pass and make sure they have a strong cycle plan established. Also a pretty aggressive forecheck.
Chaos makers would do well on high corsi teams with a shooter on their line; give them lots of chance to get in front a tip a puck in.
Physical forces need to know their skillset and lean into it. Put them in front of the net to create havok and bang in pucks shot from defensemen or bombers