
It’s time for (another) draft day! Whether your team has the 2nd or 20th overall pick in the NHL entry draft, it’s always a useful exercise to look at past outcomes and modify your expectations accordingly.
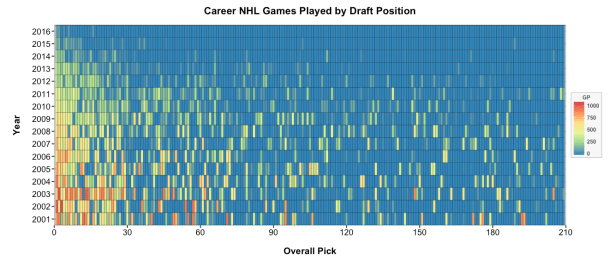
Above, we have a pretty simple NHL games played vs. draft position* heatmap, but it does allow us to pick out some things:
- 2003 was a particularly good year at the top end, as Alex mentioned earlier this week.
- Once we get past the first round of the draft, it’s hard to spot instances of players making it to the NHL more often in some draft years than in others.
- The 2015 and 2016 drafts are mostly blue because players haven’t had the opportunity to break into the league and play a lot of games. In general, it seems that players from all rounds have had enough time to develop and play up until the 2011 draft. After that, it becomes a lot tougher to evaluate outcomes, because they’re still pretty uncertain.
But wait, anyone who knows me knows that I complain roughly 2-3 times per hour about using NHL games played as a draft outcome variable. Here’s a secret: I often use it anyway because it’s so straightforward to measure and understand.
Still, I may as well graphically show another variable that’s much more skill-based:
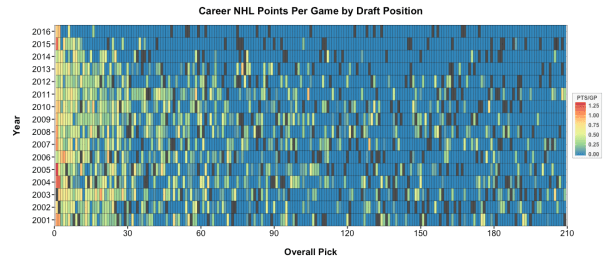
Here, I’ve zeroed out points per game for players who played < 30 NHL games, and I’ve blacked out goalies because their scoring stats are irrelevant. This provides an interesting feature in and of itself: we can easily see the recent trend of not picking goalies until the second round and beyond. We’re probably past the days where goalies like legendary Vegas Golden Knight Marc-Andre Fleury can be picked first overall.
Finally, the trio of Ovechkin/Malkin/Crosby, drafted in ’04 and ’05, completely wreck my color palette because of their gaudy point totals. They don’t really meet their match until Connor McDavid, the potential $14 million dollar man. Generational, indeed.
If you spot other fun trends, feel free to let me know. Good luck today, and may all of your mock drafts come true.
*Drafts in the early 2000s had more rounds and picks than there are currently. For the sake of equal comparison, I’ve shown the first 210 picks in each draft.

An excellent league draft summary and demonstrates how important it is to choose well in later rounds. Charts for each team’s draft history would be a great visual description of draft success or failure.