
This year’s NHL draft class is weak. I don’t follow junior prospects closely, but that’s what I’ve heard from more knowledgeable sources. It’s a fair claim; Nolan Patrick and Nico Hischier seem talented but not among the game-changing talents that have recently been drafted first overall.
However, it’s harder to judge the draft class past the very top. Scouting is hard, especially for hundreds of prospects across the world. It’s possible that while there is no clear star in the draft class, the rest of the draft is as strong as ever.
That would have big implications for draft strategy. The conventional wisdom is that teams may trade more picks this year because they believe the weak draft class makes the picks less valuable. But if the draft is typical after the first few picks, that would be a poor use of assets.
We don’t yet know how well this year’s draft class will do in the NHL. But, we can use historical data to ask questions that establish expectations: how well does each draft class typically perform, and how much does this vary by year?
In this post, I try to answer those questions and find the following:
- Around 20% of each draft class typically reach 200 NHL games played (one of many arbitrary acceptable metrics for NHL success).
- From 1995 to 2010, that percentage has varied from a low of 17% to a high of 30%.
- 2003’s draft class was excellent, but there are no clear trends in the strength of each draft class.
- We do not see evidence that confirms any recent draft class has performed statistically significantly better than the others.
This last point is most crucial. It’s statistically plausible that every draft class has the same innate talent, and the variation we see is entirely the result of random chance. The truth is almost certainly a combination of talent differences and random chance, but these results should give pause that the latter effect may be much stronger than people realize. If that’s the case, the 2017 draft class may turn out just as strong as any other, and teams that stockpiled picks in it will be suitably rewarded.
Summary Stats
To start, we can collect and examine some basic stats about how each draft class has performed in the NHL. This seems simple enough. However, there are a lot of different methodology questions that need to be answered. For now, let’s focus on the first 210 players picked in every draft, and we’ll even remove goalies because they’re a troublesome lot.
To start, what are the odds that a draft pick in each year will become a successful NHLer, which we’ll define as 200 GP? There are plenty of other definitions for NHL success, but this is sufficient for a first look. For another approach, check out Scott Cullen’s work here.
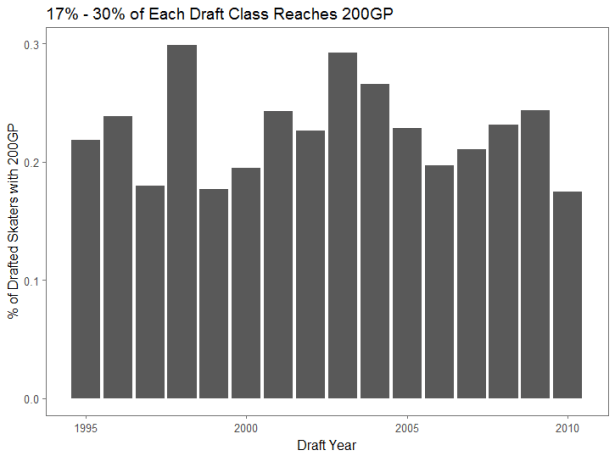
The graph ends at 2010 so that enough seasons have passed that we have a sense of each player’s career. The data is as of 2017, so a few more players from the later years could pass the threshold in coming years. There is certainly variation in how many players from each draft class make the NHL; in general, somewhere between 17-30% will play 200GP. 1998 and 2003 seem like particularly strong years, but there’s no clear trend or enormous fluctuation. 2003’s strength could in part be explained by an extra year of preparation due to the lockout, and it’s conceivable that they then crowded out some of the weaker players in following drafts.
Obviously, there’s a big difference between making the NHL and performing well once a player is there. What does point production look like from each draft class? Let’s look at points per game (PPG).

Here, the spread across years is even tighter, and it’s tough to draw any conclusions about how much of this is due to chance.
Finally, let’s conclude our summary by looking at contributions over time. From year-to-year, how many games played and points scored does each draft class achieve?


Here, 2003 continues to stand out as a strong year, which matches general beliefs. Beyond that, however, the contributions from each draft class over time stay pretty tight.
Note that there is noise here that we do not correct for. The lockout years drop production for players whose careers overlap with them. A forward-heavy draft class will have more point production than a defense-heavy draft class. And overall goal-scoring rates have changed over time within our sample.
So, what have we proven? So far, not much. Visualizations can provide some benchmarks, but it’s tough to understand what variation is from random chance and what is from more systematic differences between draft classes. If chance seems unlikely, remember that there’s inevitably going to be some variation; it would be a freak occurrence if the players in each draft year had exactly the same number of games and points. So, is that why the numbers above are different, or is there something more systematic? For that, we’ll need to dig deeper into a statistical toolbox.
ANOVAs from A. Novet
[Epistemological status: The above are all summary stats; while you can make other methodology choices, I feel comfortable that I am representing trends accurately. The below stretches my statistics knowledge. I believe all the conclusions hold. However, I want to be up front in that I am not an expert in the below techniques. Any feedback is appreciated.]
We can add rigor by performing ANOVA tests. ANOVA tests compare means across many groups; here, each draft year is a group, and we can study whether each statistic (GP and PPG) is the same between groups. ANOVA can help us divide total variability into variability due to draft year and variability due to other factors.
In order to perform an ANOVA test, we must first confirm three conditions. First, the observations must be independent within and across groups. In this case, that means that the games played for one player do not depend on the games played by another player in the same draft year or in another studied draft year. One could argue that this condition does not hold – there are a limited number of games and roster spots, so a high GP for one player makes it less likely that another player made the same team and got playing time. That said, this relationship is extremely limited. One player’s games played is not seriously impacted by one other player somewhere else in the league, so I’m not too worried about this condition.
Second, the data within each group must be approximately normal. This doesn’t hold well in our data, but should not be a major consideration because we have fairly large sample sizes, so the means are not volatile.
Finally, the variability across the groups must be about equal. We can confirm this by running the Bartlett test and the Fligner-Kileen test, which we do. Those tests present some nuances discussed below but generally show that these methods are valid.
There are two final questions to answer before running our tests: how many years of playing data should we evaluate, and how far back into past drafts should we include? I did not have one immediate option that stood out as the most meaningful, so I tried a lot of possibilities. I started with the earliest year ranging from 1995 to 2006 and the latest year ranging from 2007 (studying 10 years of post-draft production) to 2016 (studying 1 year).
This gave me 120 tests that compared as many as 21 seasons. I repeated these tests on both games played and points, bringing the total number of ANOVA tests to 240.
For points, many of the combinations failed the test for equal variation, especially the ones that only looked at the first few years of production. That’s not surprising, as those datasets are particularly sensitive to how quickly the top players from the draft broke into the NHL. Filtering down to the versions that demonstrated equal variation gave us 46 different ways of grouping the data, primarily those based on 7-10 years of data since their draft.
In the ANOVA tests, none of those 46 variations had a result showing that one draft class’ production was statistically significantly different from the others. There is more extreme variation in the first few years after the draft, likely driven by how quickly players make the NHL and start accruing points. As time goes on and players either reach the NHL or bust, the overall production of each class mostly balances out.
This is an important point. The very top players in each draft make the NHL the quickest and also tend to produce the most over their careers. As a result, it’s natural to think primarily about them when assessing a draft class. However, that can skew perception and underweight the rest of the players drafted who will start contributing a few seasons later. There could certainly be some years where the very top players are weaker than usual, but that is different from assessing the full draft class and less relevant to most teams.
The results for games played are similar. 48 versions of the data are appropriate for the ANOVA test. Of those, only 2 have a p-value below .05 indicating a significant difference in performance, and those two squeak over the line at 0.04. Those two are long samples beginning in 1997 and 1998, so I suspect they are showing that the 1998 draft class achieved an abnormally high GP. Beyond that, there are no signs of statistically significant differences between draft classes.
Conclusion: Don’t Burn Your Draft Cards
Imagine you run a 40-yard dash once a day for 10 days. Your times would be similar each time but not identical. Does that mean that whichever day you had the best time is also the day you had the most talent? Of course not. There’s random variation that occurs from the natural flukes of life.
I believe that that is essentially the difference between each draft class. There are some extremes at the edges, nothing beyond what we would expect from natural variation between equal groups.
Based on this, I suspect that after the first couple of picks, we’ll see that the 2017 draft class produces roughly the same amount of talent as any other draft year. There could certainly be a trickle-down effect where each player is weaker than usual for that draft spot because there is no generational player at the very top, but that seems very small and would peter away quickly. I’m skeptical that it should affect picks outside the top five. Rather, teams should value their picks this year with roughly the same weight they do any other year. If anything, the obvious uncertainty within this year’s draft class provides a prime opportunity for scouts to shine.
Thank you to Hockey Reference for the data used in this post. Another big thank you to Namita Nandakumar for her help coding and interpreting this project. The data and the code used to produce this work is available on Dropbox here.
