
Every year right around December 1, NHL analysts and fans alike start thinking a little more seriously about playoff chances. Although in many ways this is an arbitrary point in time, particularly when linking it to US Thanksgiving, there’s also some logic to it as well.
By the end of November, we are two months in and most teams have played 20-25 games, or a quarter of the season. And from an analytics perspective, that’s about the point when you can start making use of most of the early season data.
So while most of the traditional playoff discussion at this time of the year tends to focus on points or even where teams are in the standings, let’s take a look at how early-season shot-based metrics relate to whether a team ultimately makes the playoffs.
Although the acceptance of advanced statistics has become more prevalent, most analysis still relies on simple shot attempt ratios (or Corsi For %) and you’ll often find this cited in mainstream sports reporting now. So we could look at just how well teams are ranked in this metric and assess the likelihood of making the playoffs. We certainly understand that shot attempt ratios are better predictors of future performance than standings points, or even goal ratios.
But can we improve our ability to predict future playoff probability by adding in an additional measure? Hockey Graphs’ own @DTMAboutHeart and @mean_63 have shown that “expected goals” are even better at predicting future performance than shot attempts or goals. Expected goals take into account not only the quantity of shots taken but also the quality of the opportunity based on a variety of factors, including location, shot type, etc.
We don’t yet have a consensus model for expected goals, so the specific factors used to derive this stat will vary depending on its source. You can see the factors that go into @DTMAboutHeart and @mean_63’s calculation in the link above. For the purposes of this post, I’ve used expected goals as calculated by Emmanuel Perry at corsica.hockey simply because they were easily available for custom date ranges.
So instead of simply looking at shot attempts (Corsi), lets look at both of these metrics together and see if there is a relationship to post-season action, and even to post season success.
The Data
I pulled team performance data from corsica.hockey up to November 30 for eight of the nine NHL seasons from 2007-08 to 2015-16. For the lockout-shortened 2012-13 season, I used Feb. 28, which gave each team about 20 games played that year as compared to about 25 for the other seasons. I chose to use score, venue, and zone adjusted 5v5 data. [There is some debate as to the validity of zone adjustments at this point, but I believe there’s enough of an effect on shot attempt ratios immediately after an offensive-zone faceoff that you need to adjust for it to avoid exaggerating the metric.]
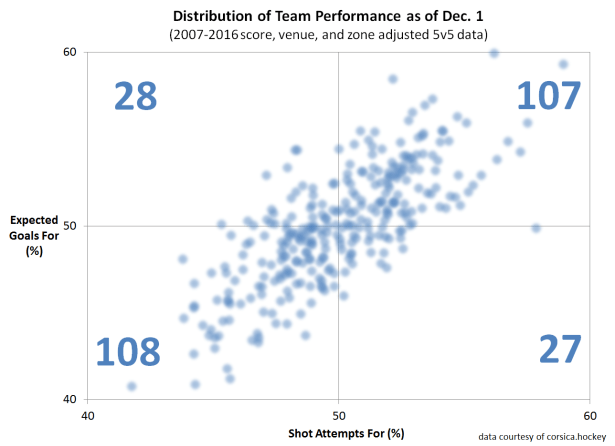
When plotted, you can see that there is fairly pronounced linear relationship between shot attempts and expected goals. The r² for this relationship is 0.70 over a full season, which indicates that shot attempts predict about 70% of the value in expected goals. This is to be expected since shot attempts go into the calculation for expected goals.
Who Makes the Playoffs?
If we now layer on whether each team went on to make the playoffs, we start to see patterns emerge.
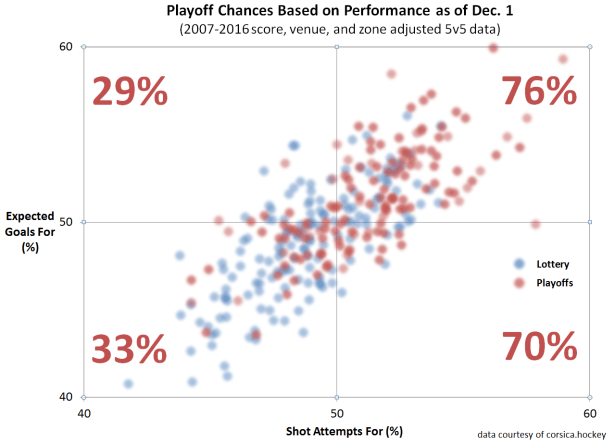
From this chart we can see that after just 20-25 games, the playoff teams mostly separate themselves from the pack. Of the 107 teams above 50% in both shot attempts and expected goals on Dec. 1, 81 (or 76%) go on to make the playoffs. Conversely, only a third of teams below 50% in both metrics wind up playing in the post-season.
Since 16 of 30 teams make the playoffs every year, the baseline for predicting who will make it is 53%. With this baseline in mind, it’s clear that shot attempts easily surpass this threshold independently of expected goals (both of the right hand quadrants are well above 53%).
Expected goals, however, do not. Only 29% of teams in the upper left quadrant, with expected goals for > 50% and shot attempts for < 50%, went on to make the playoffs. Based on this crude analysis, it appears that the early-season shot attempts ratio is a stronger indicator of whether a team will make the playoffs than expected goals ratio.
Despite the predictive power of expected goals, early season success in this metric does not necessarily lead to post-season play. There may be a number of reasons for this, and it is something I will touch on in a subsequent post.
That being said, one of the original intentions of this analysis was to determine whether looking at expected goals in addition to shot attempts would improve our ability to determine which teams might make the playoffs. The data shows that there is a marginal increase of about 1%: if we had looked only at teams on the right side of the chart (i.e., just teams with shot attempts > 50%), 75% go on to make the playoffs.
Early on, at least, it does not appear that expected goals add much to the analysis.
Who Succeeds In The Playoffs?
Since we have the data handy, lets look backward to see how playoff teams and the eventual conference finalists each year were performing across these two metrics on December 1.
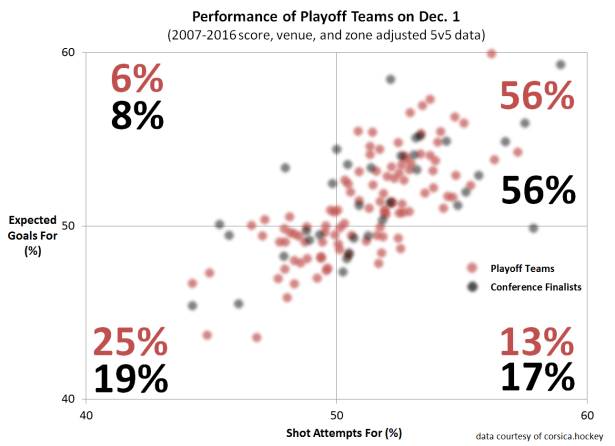
Here we see that 56% of all playoff teams were above water on both metrics as of December 1. The same goes for just conference finalists. Over half were in that upper right quadrant to start the season.
The interesting result here is that 25% of playoff teams don’t necessarily do well on either metric early on. Even one fifth of conference finalists don’t show very well in shot attempts or expected goals.
Regular Season Results
If we take a quick look at how the performance and distribution of playoff teams changes over a full season, we see an even more pronounced relationship between shot attempts and expected goals. The tightening of the distribution means there are fewer teams that are only above 50% on one of the two metrics.
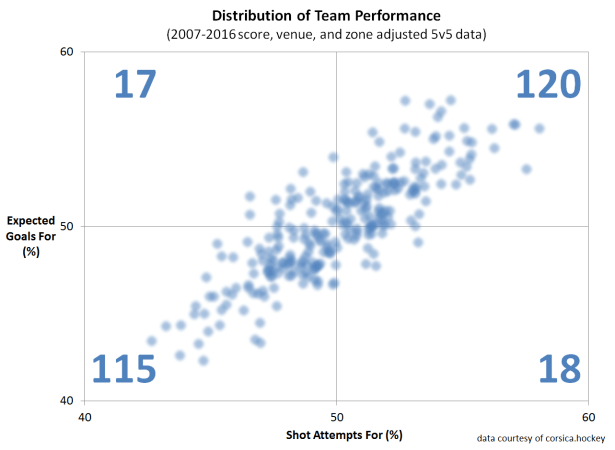
By the end of the season, most teams work their way into the upper right or lower left quadrants and are either above or below 50% on both metrics. And as they do, the relationship between success across these metrics and making the playoffs is even more pronounced:
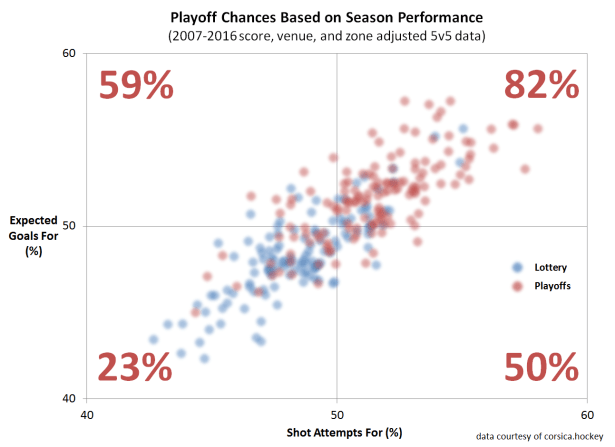
What’s interesting when looking at regular season performance is that simply being above 50% on shot attempts is no longer enough. Whereas teams in the lower right quadrant as of Dec. 1, wound up making the playoffs, by the end of the regular season only 50% go on to the post-season.
Conversely, the success rate associated with the upper left quadrant, jumps from 29% as of Dec. 1 to 59% by the end of the season.
And if we were looking at each metric independently, we can see that with a full season of data, expected goals becomes a marginally a better indicator of whether a team will make the playoffs.
| Teams Making the Playoffs | ||
| As of Dec. 1 | Full season | |
| Shot attempts for > 50% | 75% | 78% |
| Expected goals for >50% | 66% | 79% |
And when we combine the two metrics, we can see that success rate increases to 82%. So with a full season of data, the combination of metrics is incrementally better.
Finally, lets look at how the playoff and conference finalists are distributed among the four quadrants after the regular season.
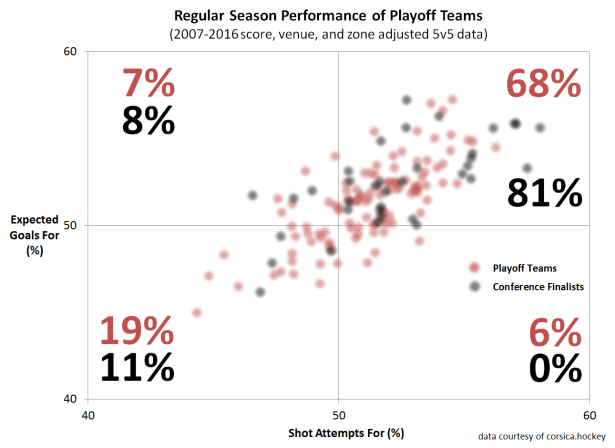
It’s here that we can really see the value of the expected goals metric.Teams that go far in the playoffs typically excel on both scales, but 32 of 36 (or 89%) conference finalists have finished the season with an expected goals ratio above 50%. And none of the nine playoff teams with an above average shot attempts ratio have made the conference finals.
Conclusions
Over the last nine NHL seasons, the first 20-25 games of shot attempt data has been a relatively good indicator of whether teams go on to make the playoffs. The addition of expected goals does not significantly improve the our ability to predict playoff teams early on.
However, by the end of the regular season, the strength of expected goals as an indicator builds and even surpasses that of shot attempts. This would appear to indicate that the expected goals metric needs more than 20-25 games before it fully stabilizes.
But What Does This Mean For My Team Right Now?
With that analysis in mind, here is where this year’s NHL teams were sitting as of December 1:
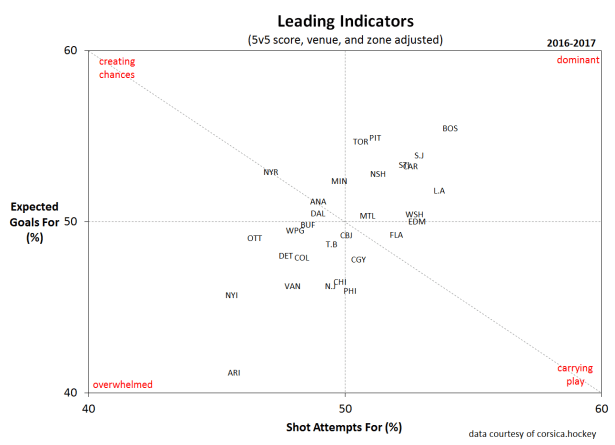
Plan your parades accordingly.
