

Just a few hours into 2016, I had already received an email from a colleague in NCAA Division I hockey program, asking for my feedback on a specific area of analytics. It goes to show that those who enjoy thinking the game never stop doing it, even on days when they should be giving themselves a little time off.
Since everyone is making New Years’ Resolutions, allow me to share the two things I will be working on this year:
Prioritizing Information More Efficiently
With limited personnel and time resources, my main challenge at McGill is to “sort out” what matters and what doesn’t. There’s only 24 hours in a day, so for me, doing a good job is as much about working hard, as it is ignoring things that don’t matter.
In this sense, I sympathize with NHL coaches and GM because they are bombarded with different types of information, both quantitative and qualitative, on a daily basis.
In many cases, when a coach or general manager makes a poor decision by objective standards, it is not because he didn’t spend enough time and effort gathering information. Instead, he probably prioritized the wrong type of information when making that decision.
While keeping a detailed account of our on-ice shot differential is still the most important part of our analytics work, our community is reaching a point where we can really dig into our transitional and passing data, and determine whether they are repeatable and contribute significantly to the bottom line.
If these metrics matter, then we will shift more time into analyzing the numbers and developing the skills which facilitate them. If they don’t matter that much – as we have discovered in past years in regards to missed shots, zone starts and quality of competition – then I can put less emphasis on those statistics or stop investing time in them altogether.
Communicating Information More Efficiently
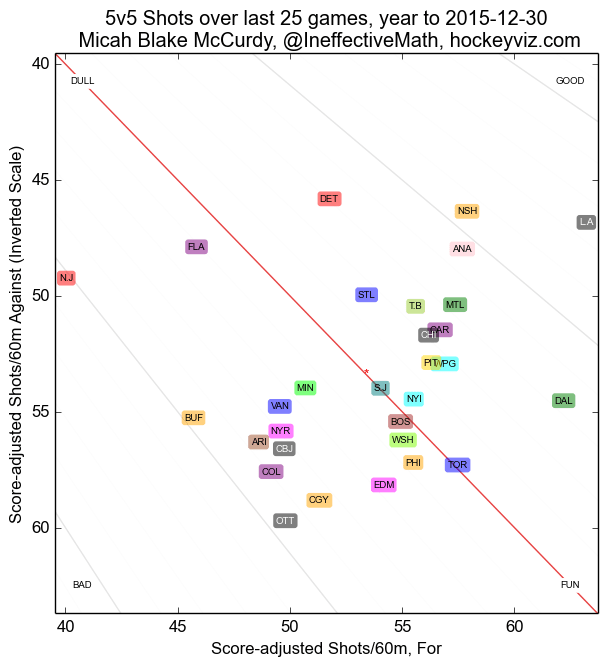
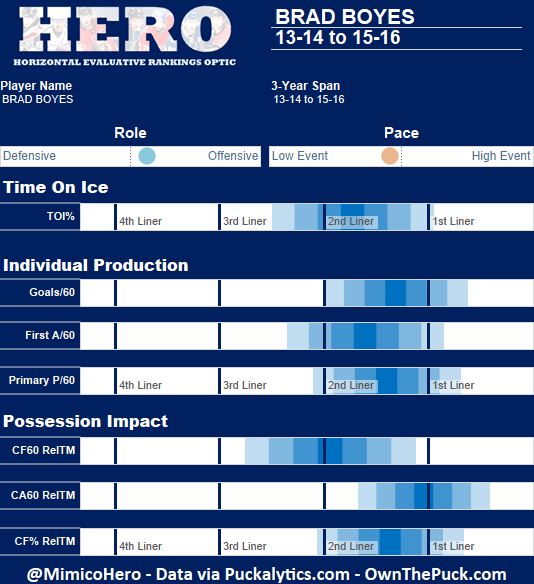
Better data visualization was a main trend in hockey research in 2015, two of my favorite examples being the work of Micah Blake McCurdy and Dominic Galamini.
Visualizations are powerful because (when done right) they tell a compelling story of where we’ve been and where we’re going.
A glance at at Micah’s shot chart tells you who’s good, who’s bad, who’s dull and who’s fun:
And a quick peek at Dom’s HERO chart gives you a pretty good idea of a player’s skillset and even gives you some foresight into his destiny as an NHLer:
But good communication isn’t just about charts and tables. Coaches are verbose people, and most stats guys (myself included), not so much.
When working for a team and around coaches, managers and players, making an effort to use an accessible vocabulary, being succinct, and being agreeable are skills as valuable as being able to master in R or Tableau. I can work on that, and if you are reading this, so can you (probably).
In the coach’s room, it’s important to understand and to be understood in equal measures, and I find it helps sometimes to start your sentences with “Coach, you are absolutely correct, and this is why,” even if you don’t agree with him just yet.
***
Jack Han is the Video & Analytics Coordinator for the McGill Martlet Hockey team. He also writes occasionally about the NHL for Habs Eyes on the Prize. You can find him on Twitter or on the ice at McConnell Arena.

Great article Jack!
I’m have education experience and I find the ‘sandwich’ works..the compliment then the criticism or need to change then another compliment..
🙂 especially when working with individuals far less educated in the topic 🙂