
Abstract
There has been much work over the years looking at the impact of competition on player performance in the NHL. Prompted by Garret Hohl’s recent look at the topic, I wanted to look at little deeper at the obvious linear relationship between Quality of Competition and observed performance.
The results are a mathematical relationship between competition and observed, which could provide insight into player performance over short time frames. In the long run, the conclusions drawn by Eric Tulsky still hold. The impacts of facing normally distributed Quality of Competition (QoC) will wash out the effects over time. But this should not preclude consideration and even adjustments for QoC when looking at smaller sample sizes.
Methodology
Big thank you to Muneeb Alam for compiling the data and sorting it into Corsi For (CF%) bins. The data was gathered from the 2007-2015 NHL seasons by parsing each 5v5 shot attempt (Corsi) event twice (once for each team) and determining:
a) For each of the team’s players on the ice, his overall CF% and the average CF% of his four teammates.
b) Average CF% of the five opposition skaters on the ice.
So, for each event we determined each player’s CF%, their teammate’s average CF%, and their competition’s average CF%. Each event was then placed in 1% bins for teammates and for competition ranging between 40% CF and 60% CF. (In order to simplify the binning, all CF% < 40% falls into the 40% CF bin, and similarly all CF% > 60% falls into the 60% CF bin.) Each bin thus has both Corsi For and Against events for a given Quality of Player, from which we can calculate an observed CF% against a given Quality of Competion (QoC) or with a given Quality of Teammates (QoT).
Finally, a note on cross-effects: the data compilation for QoC was not controlled for QoT, nor vice versa. So while we will be looking at the impact of competition in this post, the impact of teammates (and any other factors) is also present within the data, but unaccounted for.
Here’s how the data was distributed across the QoC bins:
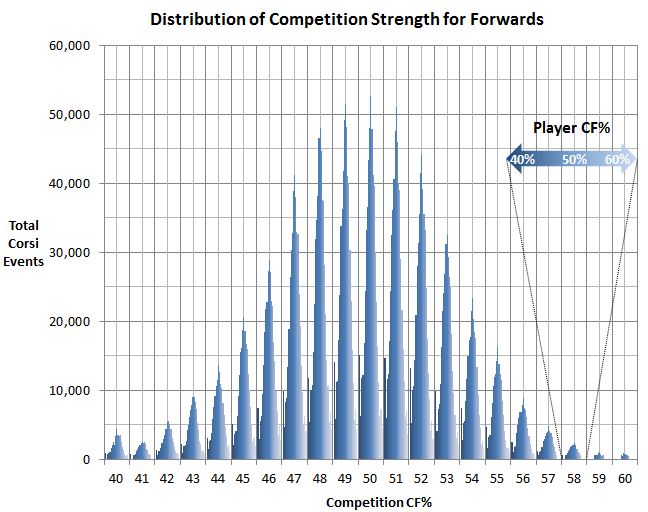
Not surprisingly, the data is essentially normally distributed around 50% CF with a slight skew to the lower end. Given that we are averaging the CF% of all five opposition skaters on the ice, the average will accumulate toward the midpoint. This also means that it’s very rare for the competition to average very low or very high CF%, especially the latter. It’s not too often that you’re going to find five players that together average 60% CF out on the ice together. It happens, but not often.
Because of the much smaller sample size at the extremes, as well as the fact that the 40% and 60% bins are both larger than 1%, the analysis will exclude those two bins. So in what follows, we will consider only players from 41 – 59% CF and only competition from 41 – 59% CF. In addition, in order to limit the effects of small samples introducing data outliers, we will (arbitrarily) only consider bins that have at least 500 Corsi events in them.
Analysis
Now that we’ve compiled and binned that data, we’re basically where Garret Hohl started in his look at competition and teammates. But where Garret provided an overview of the topic and made some observations, I want to go a little deeper and try to explain what we’re seeing when it comes to the impact of competition on the observed results.
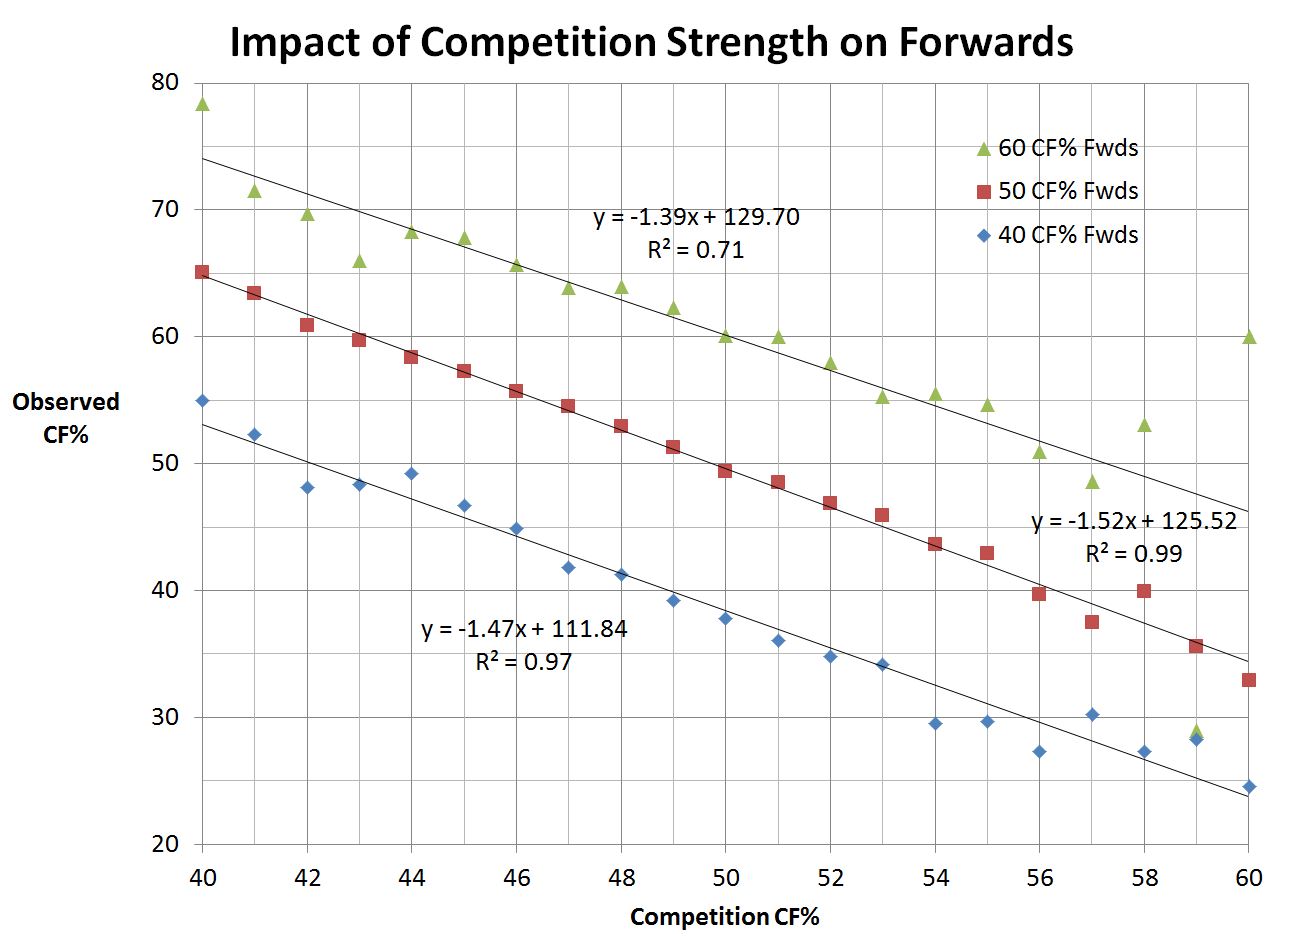
But to start, let’s plot Quality of Competition vs the observed CF% for a range of Player Quality: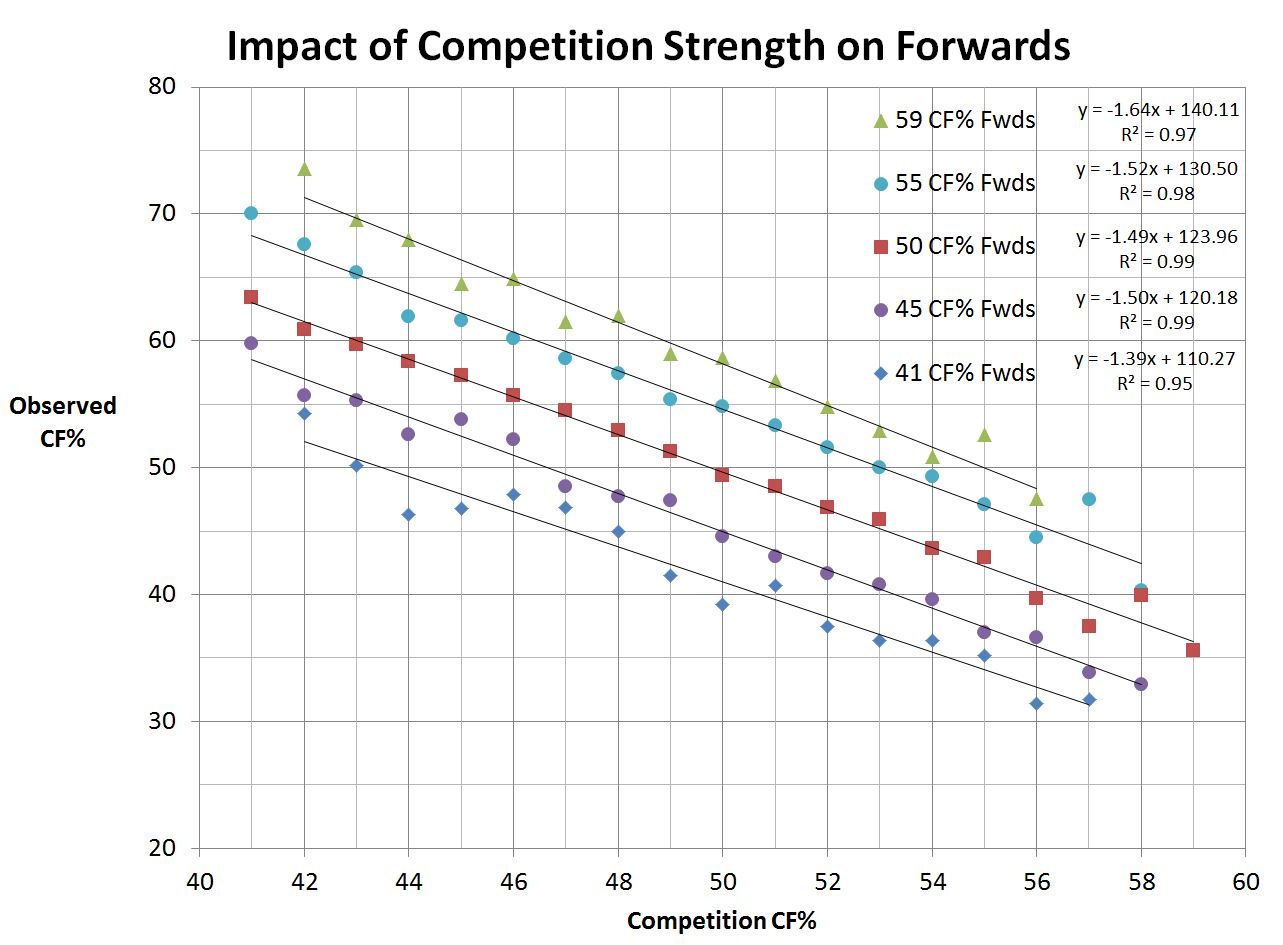
How to use the chart: to determine how a 55% CF player would be expected to do against 53% CF competition start at on the x-axis at 53% QoC, move up until you hit the 55% CF Player line (blue circles), then across to the y-axis, which indicates an observed 50% CF.
In order to simplify the display, I’ve only shown the plots for a selection of players across the range of quality. It is apparent that the quality of competition has a similar effect on observed results no matter the quality of the player under observation. As Garret observed, the impact of Quality of Competition is pretty much constant, and it is greater than 1:1. In fact, the impact, which can be taken as the slope of each line, is approximately 1.5:1 across the board. So as the CF% of the competition increases by 1 percentage point, the observed CF% for the player under observation will drop by approximately 1.5 percentage points.
This effect is independent of the skill of the player under observation.
Where the player skill does have an impact is on the starting point. Interestingly, if you look at the intercepts for each data series, especially the 45%, 50% and 55% trend lines, it appears that those lines are approximately five percentage points apart. This observation doesn’t quite hold for the 41% and 59% lines, but as discussed above, those bins hold much fewer data samples and thus would be expected to show more variance from any underlying relationship under empirical observation.
Now, with that in mind, what the eye test tells me is that this pattern is definitely not random, nor accidental. Wow, I guess Brian Burke was right and hockey really is an eyeballs sport…
I’m big on finding patterns in data, and when the patterns are this evident, it usually isn’t a coincidence. So if that’s the case, lets assume that the slight variations we see in the trendlines are simply due to variance in the empirical data. If that’s the case, then we would expect the trend lines for 45%, 50% and 55% to be most accurate most because they are based on the most data. From this, we can conclude that the vertical distance between each line is directly proportional to the difference in CF% of the players being observed.
So let’s now apply this to the data by forcing the intercept into increments that are directly proportional to the CF% of the forwards under observation:
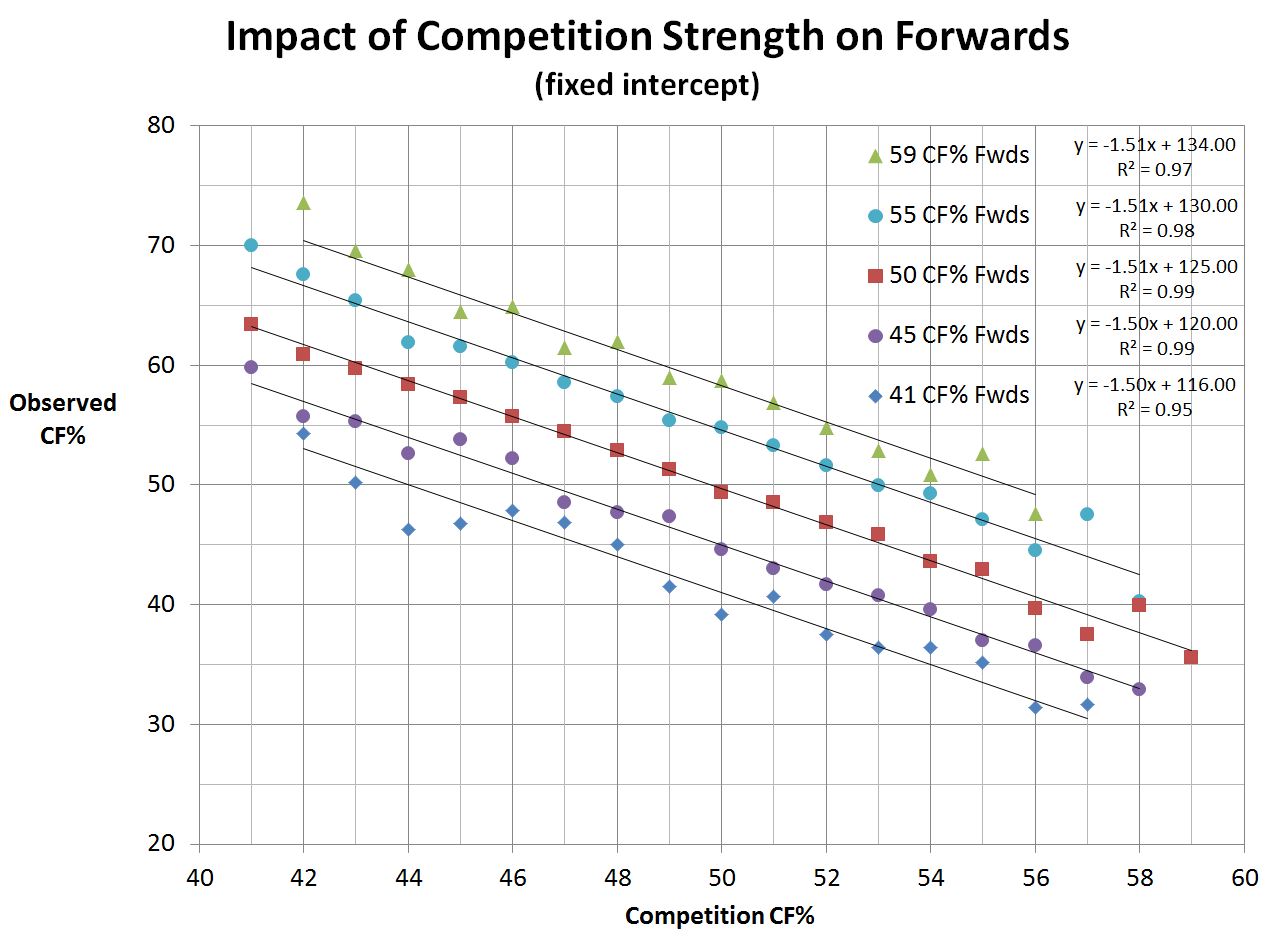 Note that I forced only the intercept of the trendlines, but by doing so, the common slope of -1.5 is even more apparent. There are still some slight variations, but this should be expected when dealing with empirical data. It’s apparent that even with a forced intercept, the trend lines still provide an almost perfect fit to the data.
We can take away from this that the observed CF% is a linear function of both the Player’s CF% and the Competition’s CF%. As a result, we can describe the entire data set mathematically as follows:

Assuming that CF% is a suitable proxy for skill level, we can restate this as follows:
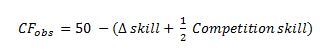
In other words, the first term is a measure of the skill difference, while the second is a measure of the absolute skill level of the competition, although with a 0.5 weighting.
Conclusion
We have shown that the Quality of Competition has a constant direct impact on the observed CF% of players at all skill levels. You’ll note that the effect is 0 when facing 50% CF competition. What this means is that over large samples, when a given player will face an approximately normal distribution of opponents, the effects of playing < 50% CF competition will tend to balance out the effects of playing > 50% CF competition.
However, over smaller samples where the average skill level of the competition would be more expected to skew to one side or the other, we would expect to see the impact of QoC be much more evident in the observed CF%. This would certainly be important over the course of a seven game playoff series, and in other situations as well. The start of a new season, for example, is also a situation where we should consider adjusting early results for the Quality of Competition.
In particular, we may be able to use this observed relationship to calculate the “true” or expected skill level of a given player by re-organizing the formula above as follows:
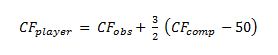
So for example, if you see a player putting up 50% CF against an average QoC at 44% CF, you could estimate that their long-run, “true” skill level is more likely to be at the 41% CF level.
The point is that Quality of Competition does matter and is important in some cases. We may have been too quick to discount its impact simply because over time, the effects are washed out. But this should not preclude the use of QoC adjustments when analyzing player performance over short periods. Based on the empirical data, the impacts of competition skill are real and they are spectacular.
Further Research Directions
Based on these results, there are several areas that could benefit from further research, including:
- At what point, i.e. after how many games, does the distribution of competition faced by a given player counteract or wash out the effects of QoC?
- We know that there is very little in the way of line-matching over time, but does the impact that QoC can have suggest that coaches should consider adopting a hard line-matching strategy? Previous work says the answer is no.
- How do we account for the cross-effects of teammates on the impact of QoC?
- Can you apply these findings at the team level, and if so, can this be used to improve the various predictive models that have been developed? It should be noted that at the team level, we would not need to be concerned about cross-effects from Quality of Teammates.
Thanks again to @muneebalamcu for compiling the data and to @garrethohl for revisiting the impact of competition and teammates, which got me started down this path. You can find me on Twitter at @petbugs13.

So this means that there is an observer or else there wouldn’t be any competition. Dude, I think you just explained how God must exist! Jebus will be happy to hear the news!