
Last Year, I unveiled a hockey version of the baseball Marcels forecasting system in an attempt to forecast the future performance of goalies. The idea behind Marcels is simple: we take the last few years of a player’s performance and then weight more recent numbers higher than older numbers. In addition, we regress the player’s #s to the mean (with a player who has a larger sample being regressed less than one with a smaller sample) and, if we’re projecting for the future, we adjust the overall #s for aging. Again, this is a very very basic projecting system, but its’ been proven to be incredibly well founded for baseball, and probably for hockey as well.
So let’s take a look at how things have changed now that we have data from the most recent season. We now have a few goalies with enough data to run Marcels on that we didn’t previously (although barely in most cases) and a few goalies have had large turns in one way or another in their career, which changes the projections.
Again, as a reminder, here is our methodology:
METHODOLOGY (Skip if you just want the results, but it’s important)
The earlier post was building upon Eric Tulsky’s work which found that the following weights gave the best results at projecting future performance by goalies over the next three years:
So in my base case, I’m using years 1-4 to try to predict years 5-7. The best predictions came from weighting things like this:
- Each shot faced in year 3 counts 60 percent as much as shots in year 4
- Each shot faced in year 2 counts 50 percent as much as shots in year 4
- Each shot faced in year 1 counts 30 percent as much as shots in year 4
In addition to the weighting explained above, we are regressing each goalie’s #s by adding 1525 shots saved at a league average rate to their sample. And, if we are projecting 3 years in the future, we are adding an aging adjustment, which I have written about Previously.
RESULTS:
Note: The below numbers rely on data through the end of January:
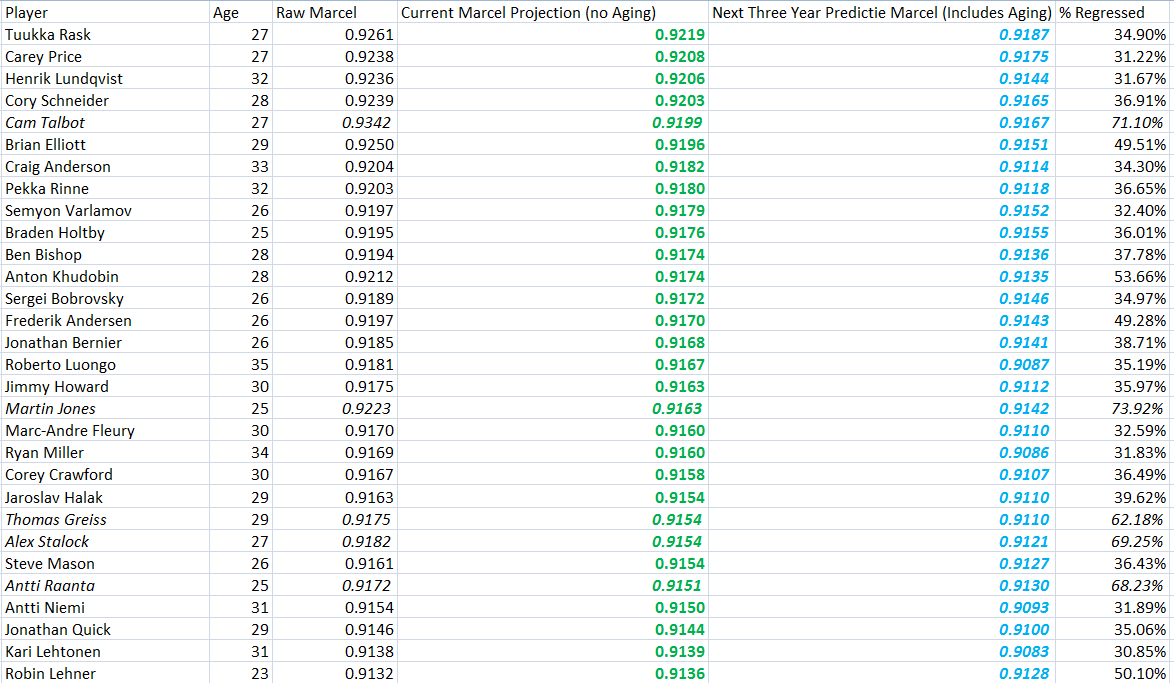
The Key #s above are the Green and Blue Numbers. The Green are the projections of each goalie’s save percentage right now, before any aging kicks in. So we project Tuukka Rask to be a .9219 goalie for basically the rest of this season, the best of any goalie in the league. Similarly, we project Ilya Bryzgalov to be a .9073 goalie, which is fairly poor.
If we’re projecting further in the future, such as the next three years, we go to the blue column, which takes into account aging. So we basically project Lundqvist to drop substantially below Rask and Price over the next 3 years (down to JUST above average) because he’s a few years older.
Note: The Players in italics have their #s regressed over 60% of the way toward league average due to the lack of a good sample size – you can see how much in the rightmost column. So Cam Talbot may project very well, but well, given that we’re regressing him over 70% toward the mean, we really aren’t projecting him with much certainty (doing things like adding AHL #s in would help here, but that’s beyond the simplicity of this exercise).
DISCUSSION:
The #s above speak for themselves, but there are two goalies I’d like to talk about since I think some in the hockey analytics community misanalyze them. The standard method in the analytics community for evaluating a goalie is going by career save percentage. Based on this, Steve Mason (.909 career SV%) is a well below average goalie and Brian Elliott is a little bit below average (.912).
However, both guys’ career numbers are so low because they had horrible numbers a number of years ago: Mason had his last terrible season 3 years ago, while Elliott had his last truly awful season 4 years ago (3 years ago was bad, but still well above his previous history). As such, Marcels doesn’t think either guy is bad…..
In Fact, Marcels think Mason is basically a just above average goalie these days on the line with guys like Halak, Quick, and Niemi and at 27, he’s not due for humongous aging effects. Elliott meanwhile projects as a nearly .920 goalie, 5th best in the league presently (not counting Cam Talbot) and at his age is also likely to stay above average for the next three years. These guys may have been truly terrible in the past, but seem quite likely to have actually improved, rather than just found their way into fluky good seasons.
