
Faceoffs have always been an interesting area of research. There have always been individuals in the media and public who extol faceoffs importance; I have even heard quotes like: puck possession is so important and you cannot win the puck possession battle if you are starting without the puck.
Not too long ago Gabriel Desjardins showed that the impact of a faceoff is real (as one would expect) but likely over glorified by some. One example from his study showed shot rates after an offensive zone faceoff:

From these numbers Desjardin estimated an impact of +2.45 goals for every 100 non-neutral zone faceoff wins over 50%, and +3.66 for every 100 for special teams. A real impact, but not overly huge impact. Neutral zone faceoffs carried even less of an impact with +0.90 goals for every 100 faceoffs over 50%.
But what about faceoffs overall relationship with possession?
I recently have done some univariate analysis here on Hockey-Graphs, so I thought I would continue that here to get us started. I gathered all teams for every 82 game season since the 2007-08 season, the season where we first gathered shot attempt data.
Here is the distribution for faceoff percentage:

We see a predominately normal shape with a slight skew, and the statistics (coloured in red) confirm that the data is indeed normal shaped.
Then there is the distribution for Corsi percentage (a statistic well documented for its relationship with scoring chance differentials and puck possession):

The distribution seems even more normal shaped than faceoff percentage, and the numbers seem to indicate the same. The distribution is wider, as confirmed by a much larger standard of deviation and coefficient of variation.
We can compare the two distributions differences by using box-and-whisker plots:
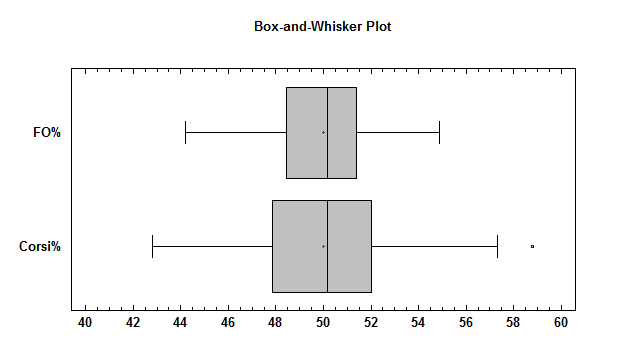
Nothing new here except now we can visually understand the differences between the two distributions.
Now all this is interesting, but what about the relationship between the two. We know there is likely a relationship through intuition and also Desjardins study on the impact of faceoffs (which helps display the causality of faceoffs in possession).
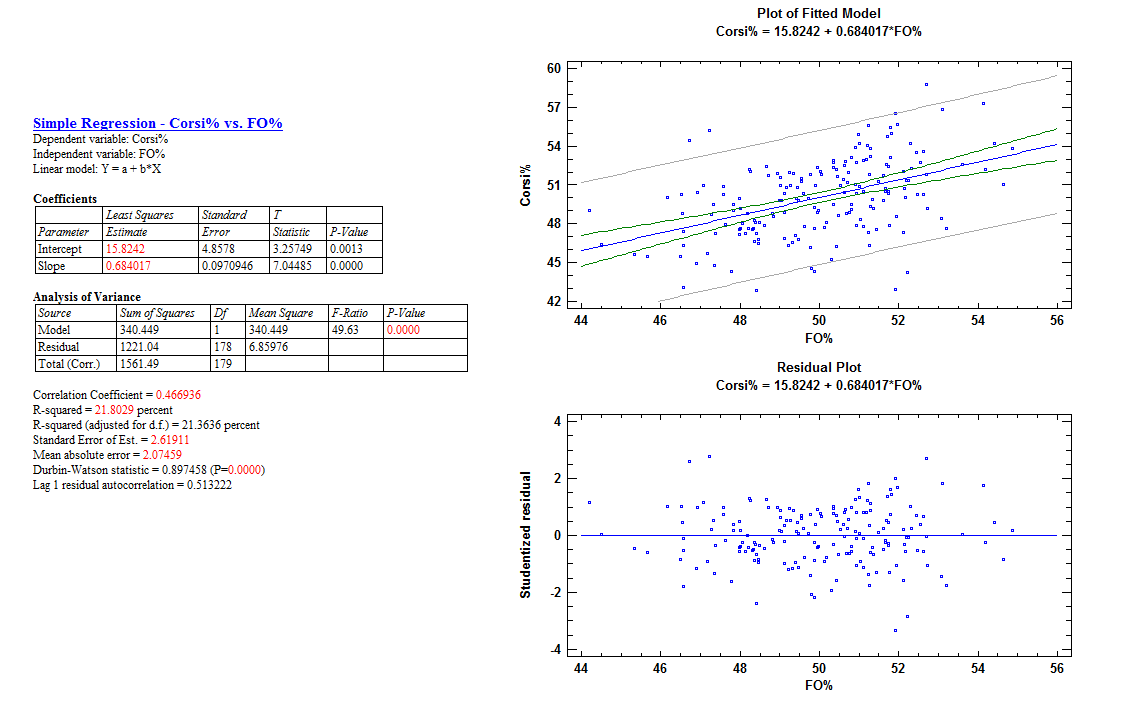
There is enough statistical evidence here that we can dismiss the notion the two are not correlated (null hypothesis) and so from this information we would conclude there is a significant relationship between the two.
There are still many who perform well in the faceoff department yet are outpossessed and vice versa. The largest outlier were the 2007-08 Atlanta Thrashers, who had a 5v5 faceoff percentage of 51.2 but a 5v5 Corsi percentage of 42.9.
(Editors Note: Origionally read as Corsi percentage of 52.9, which was a typo)
The R-squared value indicates that a team’s faceoff percentage explains about twenty percent of the team’s Corsi percentage.
At first, I was a bit taken aback with the R-squared value. It seemed a lot higher than I had anticipated. There is the caveat though that correlation does not equate to causation.
There are a few reasons why the impact may not be as high as the numbers indicate.
For one, a faceoff battle is simply a set-play puck battle; skaters who perform well in faceoffs can also help their team’s possession by performing well in other puck battle situations. The correlation with puck possession could be picking up both impacts.
Secondly, most coaches know their team’s strengths and weaknesses. They know which centres are the better faceoff options. They also know if their team performs relatively better in breakouts, sustaining pressure in the offensive zone, and neutral zone performance. A coach may improve the impact of their faceoff percentage on their Corsi percentage by taking these into account and also by deploying their faceoff specialists predominately in non-neutral zone situations.
The next step would be looking into individuals, both by this method and Desjardins method (which I did a bit here with the Winnipeg Jets centres last summer).

Mallhotra is he still training faceoff skill techniq with Canucks? 🐋