
I was born into a family of Islander fans, so I never had a chance to avoid the sadness that comes with that fandom. While Islander fans are sad for a lot of reasons, one constant complaint over the past several years has been their inability to protect a lead.
However, this is not a unique complaint of Islander fans alone. Fans of other teams have similar gripes. For example, the Leafs have been criticized this season on the same grounds. And here’s fellow Hockey Graphs write Asmae when I suggested doing some research on blown leads:

So, are some teams particularly bad at holding leads? Asked another way, is keeping a lead a skill distinct from the rest of the team’s performance, or is it just a function of the team’s overall skill and luck?
In theory, I could see cases either way.
On one hand, people believe something is more common if they can remember multiple instances of it. I watch a lot of Islander games, so of course I remember more of their blown leads than any other team. That doesn’t necessarily mean that they have a unique problem, I’m just a biased analyst. On the other hand, maybe there is some defensive system or player trait that is particularly effective at holding onto a lead.
In this post, I introduce some measurements of blown leads and demonstrate the following:
- There are ways to descriptively measure how well teams protect leads, and they are small improvements on typically used points like “record when leading after 2 periods”
- Holding leads is a repeatable skill that will stay consistent for a team, BUT
- Protecting leads is almost entirely a function of a team’s Goals For % and does not add any additional information to whether a team will win or lose
My key point is that we can measure how well teams have protected leads in the past, but there is no “protecting a lead” skill or system for a team that is separate from their general ability to outscore their opponent in any other situation. Good teams protect leads because they tend to score more than their opponents all the time. Bad teams tend to blow leads because they always tend to get scored on.
Descriptive Data, or, 43% of the Time It Works Every Time
To calculate how well teams protect leads, I looked at every regular season regulation lead obtained in from 2007-2008 to 2015-2016 (to my knowledge, every lead except one has been a regulation lead). This gave me 270 team-seasons of data. On average, a team will have 72 leads in a full season, and will successfully protect 41 of them until the end of the game, so our sample sizes are useable but not enormous.
I calculated 3 different metrics to measure lead protection. The primary one is Lead Protection Rate (LPR), which is simply the percent of all obtained leads that the team maintains until the end of the game. Note that this treats all leads equally, regardless of how many goals they lead by or when in the game it was obtained.
Second, I made 3rd Period Lead Protection Rate (LPR-3), which only looks at 3rd period leads. These includes both leads from earlier that carry over into the start of the 3rd plus new leads that come from scoring in a tied game during the 3rd. Finally, we have Late Game Lead Protection Rate (LPR-Late), which is analogous to LPR-3 but looks at only the final 5 minutes of a game.
The distributions of these stats are shown below. The average team will have an LPR of 43%, meaning that 43% of the time that they get a lead, they will hold on to that lead and win the game. Unsurprisingly, when you narrow the view to leads later in the game, the protection success rate goes up; the average LPR-3 is 59% while the average LPR-Late is 89%.

And just for fun, here are the teams that have been best and worst at protecting leads

Best Lead Protection Rates (LPR)

Worst Lead Protection Rates
Relationship with Winning, or, Don’t Always Use Protection
Now we know lead protection can be measured, but should it be? There are some things we need to check. First, we need to know if these stats are repeatable. We can measure lead protection in the past, but it is not very valuable if it doesn’t tell us anything about the future. Second, we want to see if it provides additional information about winning beyond what we already have available. I’ll show that LPR-Late fails the repeatability test, while LPR and LPR-3 do not expand win predictivity beyond what we know from GF%.
To test repeatability, I split each team’s games each season into even and odd buckets and checked the correlation:
| Metric | Split-Half Correlation |
| LPR | 0.24 |
| LPR-3 | 0.22 |
| LPR-Late | 0.01 |
I also tested repeatability with year-to-year tests and by grouping seasons into buckets of 3, and these had similar results. LPR is moderately repeatable, as is LPR-3. But LPR-Late is not. Goals are fluky, and protecting leads in a timeframe as short as five minutes is basically luck; knowing who was good at it last season won’t help you predict who can do it again this season.
This is particularly important because many teams have specific strategies or role players in mind for the final high-leverage minutes of a game. These findings suggest that looking exclusively at performance in a time sample that small is inadequate (or at the very least, we don’t have the data to tell which teams are reliably good at it).
LPR and LPR-3 remain, but how useful are they? To answer this, we should take a step back and see how related they are to metrics we already have:
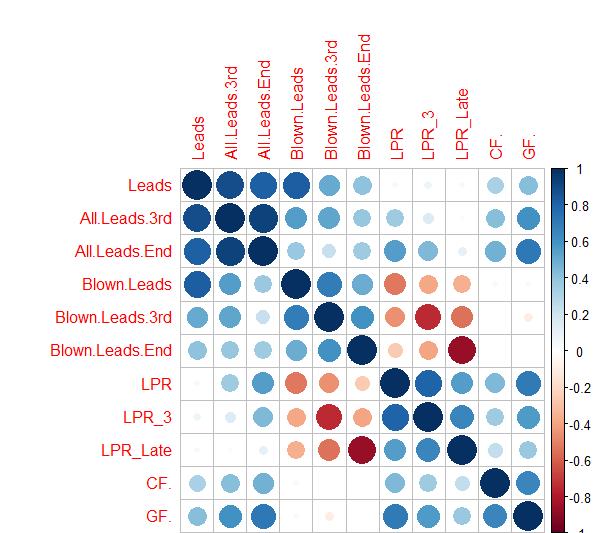
Unsurprisingly, the three lead protection metrics are correlated with one another and have an inverse relationship with the raw number of blown leads each team gives up. More interestingly is LPR’s close relationship with more general performance measures: Corsi For % and Goals For %. In fact, LPR’s in-sample correlation with GF% (.71) is even stronger than the one between CF% and GF% (.66).
This is important and is the first hint of the flaw that will be LPR’s undoing. LPR is only valuable as a predictive tool if it adds more information that what we already have. Given its close relationship with GF%, we have to study whether we can better predict winning by including LPR or ignoring it.
To test that, I ran two regressions: LM0 assessed total standings points for each team based only on GF%. LM1 was similar but also added in a new coefficient for LPR. Here are the results:
| Model | GF% p-value | LPR p-value | Adjusted R2 |
| LM0 | .000 | N/A | 0.88 |
| LM1 | .000 | 0.532 | 0.88 |
GF% is very significant if you want to predict how many points a team earned that season. Once you include that information, LPR does not offer any additional value. Comparing these two models in an ANOVA test gives a p-value of 0.53, again showing that lead protection does not provide additional value.
Put another way: if we were in a contest to guess the standings, and you only knew each team’s GF% while I knew that and their LPR, I wouldn’t be expected to do any better than you.
Conclusion and Next Steps
These negative results may sound disappointing, but they’re not. Rather, they teach us something about hockey: protecting a lead is not different than trying to outscore your opponent any other way. A team that’s bad probably got lucky to have the lead, so they are more likely to lose it.
Imagine my beer league team played the San Jose Sharks and automatically started with a 1-0 lead. My team would blow that lead almost immediately, but it wouldn’t be because we’re particularly bad at protecting leads compared to other skills. It’s just because the Sharks are way better than us at hockey.
Whether or not the team protects leads should not be used as a diagnostic tool. If a team is blowing a lot of their leads, the solution isn’t necessarily to get more shutdown players who can prevent the next goal; rather it might be to get better offensive players so that the lead becomes larger. The route you take doesn’t matter as long as you build a team that consistently outscores their opponents.
There are plenty of ways to both improve on this work and to expand it. This initial look could be improved with additional predictivity tests and refinements around the size of the lead. Even better would be to add in a measure of expected points to get the unique strength of any particular lead.
In addition, new ways of looking at this data could include studying leads at the player level or assessing the impacts of penalties on protecting leads (thank you to Asmae for this suggestion)
All of the code used to produce this work is available on DropBox here.
This post was possible thanks to the data downloads available on Corsica.Hockey. If you enjoyed it, please consider contributing to Corsica’s donation page.

could you potentially aggregate the data for just the last three years and then rank teams?, specifically where do the Isles fall? Is the perception that the Isles blow leads true?
I don’t have groups of 3 years on hand, but ranking each year separate is easy to get. In short, the Isles were one of the 5 worst teams at holding leads every year from 2007 to 2014. Their LPR ranged from 30% to 35%, meaning that they would blow two-thirds of their leads. In the last 2 seasons they’ve improved: they were 9th last year at 48% and 18th the year before at 40%. This matches the general trend that LPR is related to GF%; the Isles were awful in those early years, and their LPR went up as they improved
So last year they blew 52% of leads. Where are they now? I understand the GF% and LPR correlation. Essentially they are the same metric, that using LPR adds no additional value/variance.
Unfortunately, I don’t have data for this season. I got the pbp through the scraper export that Manny provides on Corsica, and it only has downloads for completed seasons. Until I sit down and set up my own analogous scraper, I won’t have current year info
First of all, great work!
However, correct me if I’m wrong, but shouldn’t you be using a non-parametric analysis of variance, rather than ANOVA which assumes a “normal distribution”?
The graphed data looks as though the data does not have a “normal distribution”, so your findings may be inaccurate. Although, you may have done other analyses to determine that the findings are similar to the results from non-parametric analyses.
Just curious if the findings would be different if you used non-parametric tests for the data with skewed distributions.
Cheers!
Thanks, Anthony! I haven’t done other analysis to compare to non-parametric analyses, so it’s quite likely you’re right. My statistics knowledge is unfortunately pretty limited, so feedback like this is genuinely very helpful in figuring out what else I need to learn. I suspect that the results will remain the same, given that the adjusted R-squared was identical and LPR wasn’t significant in the regression. That said, I’ll definitely take it as an action item to look into non-parametric analysis and follow-up with what I find.
It’s likely that there won’t be a difference, but with small samples it might make a difference.
I’ve also been curious why I haven’t seen more people researching high risk scoring chances for/against in as much depth as corsi. It would seem to me, intuitively, that a harmless shot from the point is qualitatively different from an odd-man rush (even if they’re unable to connect on a shot). The frequency of high risk scoring chances seems more indicative of quality play that is likely to lead to goals, and therefore wins.
I guess it is easier to get data on shots, but it seems that there are people out there recording the scoring chance data.
Curious if you plan to look into that? If you have and I missed it, my apologies.
Crossposting my comment a discussion on Pensionplanpuppets.com (http://www.pensionplanpuppets.com/2017/2/25/14670008/a-tautology-of-hockey-or-why-the-toronto-maple-leafs-blow-leads)
So paraphrasing your three points:
1) You can better describe how well teams protect leads
2) Holding leads is repeatable
3) Holding leads doesn’t better predict wins than overall team results
Since you are using descriptive stats (save for CF%), as outlined in point 1, it seems to me that you haven’t proven that “keeping a lead [is/isn’t] distinct from the rest of the team’s performance, or [is/isn’t] a function of the team’s overall skill and luck”.
The act of giving up a lead is simultaneously the act of hurting team GF%. There’s no surprise that the two results are very heavily correlated, how could they not be. It’s no surprise that if you just looked into the smaller half of the game that we call holding a lead (and ignored acquiring a lead), basically measured the GF% of that part of the game and compared it to your GF% in both parts of the game, the latter, overall measure would do better in predicting overall performance. That doesn’t mean that lead holding is without meaning.
This is akin to saying that when PP success rate goes up, team GF% goes up, but team GF% is more predictive of win rates so PP success isn’t meaningful.
So I don’t think we’ve started to disprove the idea that holding a lead and acquiring a lead are different (the ‘secret’ to protecting a lead). If we were to start, we might instead begin with the question: is lead holding success (aka success in a select, but foundational, game state) more predictive of future lead holding success than team GF% (or success in all game states). Or am I missing something?
Thanks for your comment. I agree that the correlation between team GF% and lead protection doesn’t prove anything. To me, the evidence that lead holding isn’t distinct from overall goal-scoring comes from the regressions later on in the piece. Of course the GF% data for the long period will be more predictive of overall performance, but once we control for that, LPR doesn’t add any predictive power whatsoever. It’s also a bit different from GF% in that time period (though obviously closely related) since it’s a binary about the lead rather than a measure of goals on both sides.
I see where you’re coming from, having wrapped my head around similar questions for a while, and it’s definitely possible that I’ve made a mistake (see the comment just above yours for one). For now, that’s the evidence I’m leaning on for my conclusions.
Thanks for the quick and thoughtful reply, Alex.
I’m not sure what evidence the regressions since it seems to me that LPR is already a subset of GF%. In other words, your team’s overall performance as (suitably) represented by GF% is already a partial product of your LPR. So adding your LPR again shouldn’t be expected to improve the predictive capacity of GF%, because it’s already in there. If that’s the case, the regression is upsetting the implicit balance of GF%, by inadvertently shifting weight away from your team’s ability to acquire leads, the other half of team success. That said, I’m surprised GF%+LPR doesn’t have a lower correlation than simple GF%, so maybe we’ve come full circle.
@Anthony: I agree it’s definitely worth looking into further. I need to do some reading to figure out the best way to do it, and I’ll share an update once I have.
As for scoring chances, there has been work comparing their predictive value to corsi, and I haven’t seen good evidence that it offers real improvements. (A lot of this was done before I was super active in the analytics community, so I don’t know the full scope with 100% certainty.) Here is a post that does a good job pulling work from several places: http://www.hockeyprospectus.com/burtch-examining-scoring-chance-data/. In addition to sample size issues, scoring chances also have problems because there’s some arbitrariness to what exactly counts as a scoring attempt.
That said, you have an entirely valid point about the problems of counting a harmless point shot equally with an odd-man rush. That’s why a lot of work in the past year has been moving from adjusted-corsi models to models based on expected goals. These models attempt to weight each shot based on its quality (as determined from the available info on location, shooter, etc.) This is very much a work in progress, but it includes more information about the value of each shot without arbitrary 1/0 cutoffs like scoring chances. Here’s a good example of where we’re currently at: https://hockey-graphs.com/2015/10/01/expected-goals-are-a-better-predictor-of-future-scoring-than-corsi-goals/
@pumpedtires: Always happy to talk. It’s the best way for me to figure out which parts I have wrong.
I think the main difference between us is that we’re conceptualizing LPR in different ways. If I understand you correctly, you’re thinking of LPR as a subset of GF% because it’s the GF% for the periods of time where that team has the lead. That’s a reasonable way to look at it, but I think it’s missing a bit.
I think of LPR a bit differently. To me, LPR is a contextual measure that looks at the situation in a way that is related but separate from GF%. To LPR, precariously holding a 1-goal lead is the same as cementing victory by scoring 4 more goals, but those are 2 very different situations when measured in GF%. Similarly, Allowing a tied game is the same to LPR as allowing a tied game and then giving up 4 more. LPR loses the granularity of counting each individual goal in order to gain the info of the changes in lead. For that reason, the regression shows that this latter info about losing leads doesn’t add any additional value. I could be thinking about this incorrectly, but that’s where I’m currently landing.
No I believe I understand the simplification that LPRs make. I’ll try a different angle, using your conclusion:
“[P]rotecting a lead is not different than trying to outscore your opponent any other way. A team that’s bad probably got lucky to have the lead, so they are more likely to lose it.”
It is different. Otherwise the correlation between GF% and LPR would be 1, right? It’s different because the goals slightly change depending on if you’re holding or chasing a lead, if you never score with a lead you can still succeed every single time.
The second part is circular. A bad team has a bad GF%. How do you have a bad GF%? Partly by failing to protect leads, failing to maintain greater than 50 GF% after it’s acquired during a game. So you’re a bad team partly because you fail to protect leads.
Gotcha, thanks for explaining, that all makes sense. You’re right that there is a circular element to it. I think that the results are still valid, but there is definitely some baked-in relationships that may not be successfully parsed out
I would get so pissed at Quenville, when he’d have the Hawks just clear the zone for 5 or 10 minutes. I always felt that that wasn’t the correct way to hold a lead. Especially when you’re the better team on the ice! Hell, go score another goal and you won’t have to worry about holding the lead.
Any by the way, I don’t think dumping the puck in, is a proper way to play the game. I don’t know if there are any stats on that, but when they finally come up with some, they’ll see that they’re just giving the puck away, almost every time! And THAT should be scored as a turnover; I don’t care that they did it deliberately. Just because they dumped it in on purpose doesn’t change the fact that the other team got possession. TURNOVER!
Yup! It turns out there has been analysis on zone exits and entries, and the stats agree with you! The key paper is http://www.sloansportsconference.com/content/using-zone-entry-data-to-separate-offensive-neutral-and-defensive-zone-performance-poster-2/, but it’s a bit complex. The takeaway is that teams get way more shots per entry when they carry the puck in than when they dump it. Even if you factor in carries occasionally leading to turnovers and shots against, carries are far superior