
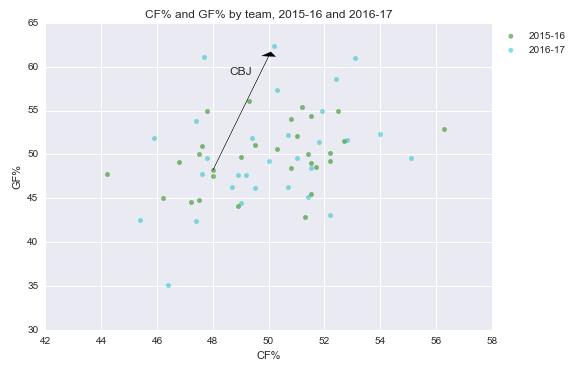
Columbus has been surprisingly good this year. As of this writing, the Blue Jackets are first in the league in points and goal differential with games in hand. Remember: Columbus, in terms of preseason predictions, was pegged as more like a 5-8 finisher in the Metropolitan division (e.g. see here, here, here, here, and here).
That said, it’s still early. If it might take 70 games for skill to overtake randomness in terms of contribution to the standings, and if teams like the 2013-14 Avalanche and 2013 Maple Leafs (to name two prominent examples) can fool us for so many games, it doesn’t seem so unbelievable that a team could do it over just 32. (And the Blue Jackets aren’t the only example this year, either–Minnesota is under 48% possession and has a 103+ PDO right now.)
Columbus has gone from below-average to elite. Or has it?
It can be very helpful to take prior beliefs into account when the sample size is relatively small. That’s the Bayesian approach.
Our elementary school, “frequentist” statistics approach doesn’t do this: following it, we’d look at Columbus’ stats this year and say the Blue Jackets are a “true talent” 5v5 ~50% Corsi and ~62% goals team at 5v5, plus or minus a standard deviation (2.9 percentage points in Corsi and 4.3 points in goal ratio; well, maybe more, since I took full-year SDs, not 32-game SDs).
I won’t demonstrate the usefulness of the Bayesian approach for this question. Its utility in a broad range of contexts is well-documented, and you just need to do some quick Googling if interested. Rather, I’ll just show how our take on Columbus’ “true talent” can change.
(Note: I posted the code and charts from here on Github. It’s Python3.)
(Note 2: This is not the first hockey analytics foray into Bayesian stats–see Garik’s post on Bayesian score-adjusted Fenwick from a couple of years ago, for example.)
Taking prior beliefs into account
Take a look at Columbus’ stats in the graph above again. 50% Corsi is fairly typical. But 62% in goals is basically unheard of. The only teams to maintain it over the course of a full season (since 07-08) are the 09-10 Caps, 10-11 Bruins, and 13-14 Bruins. All elite teams.
Intuitively, it doesn’t seem like Columbus belongs in that group. They’re more likely a great team on a good run, or a good team on a great run, or an average team on an incredible run, than an incredible team on an average run.
Mathematically, the probability of Event A given Event B (“posterior”) equals the probability of Event B given Event A (“prior”), times the probability of Event A (“evidence”), divided by the probability of Event B. In words, you “update” your “prior” belief to a “posterior” by “multiplying” by the evidence you observed or collected.
If we use an “uninformative” prior (that takes any value as equally likely), this is equivalent to our elementary school stats approach.
In practice, picking a good prior can be difficult, since we can make them arbitrarily complex. And, when possible, you want to pick them a priori. But I’ll pick priors here based on data (“empirical Bayes”).
A prior belief for Columbus
To start, let’s use a pretty simple prior for CF%: Columbus is a team in the NHL. That means it comes from the league-wide distribution of CF%. Below, I plotted the CF% of each team in each season since 07-08.
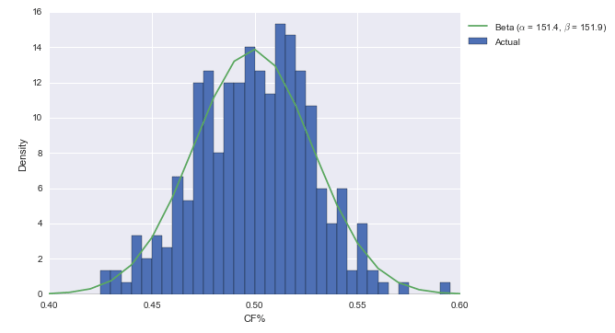
What I also did is fit a beta distribution to the data. As documented in this R-bloggers post on Bayesian batting average estimation, it’s really easy to turn beta priors into posteriors. The beta takes two parameters, alpha and beta; call them A and B for the prior. If you get a hit in H at-bats and don’t get a hit in M at-bats (“m” for “miss”), then the beta posterior’s parameters are merely A+H and B+M. In other cases, we may have had to use some integration or Monte Carlo Markov Chains; here, it’s just addition. Pretty convenient.
Anyway, the beta fits the data pretty well. Not perfectly, but it’s decent. So let’s now “multiply” by the evidence. I’ve got the Blue Jackets at 1433 CF and 1420 CA this season. So with a beta(151, 152) prior, the posterior is beta(1584, 1572). Here’s what that looks like visually:
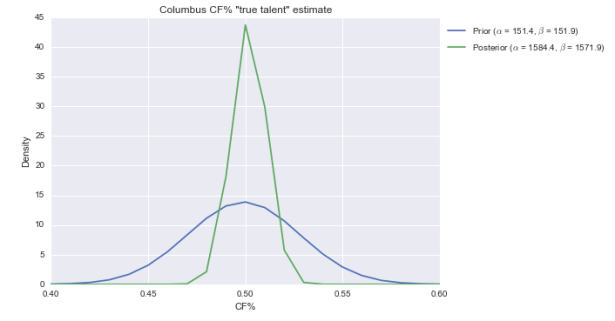
The center of the distribution has hardly changed. That’s not surprising. Columbus has an average CF%, and we say they come from a distribution that’s centered and most likely around 50%. But the posterior is considerably slimmer than the prior, meaning we’re more confident Columbus is roughly average in CF% than we were before.
Let’s apply the same logic to GF%.
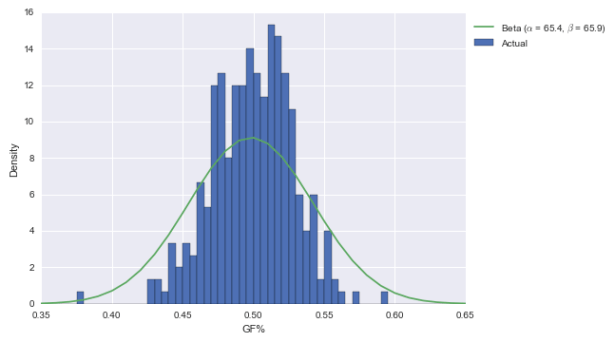
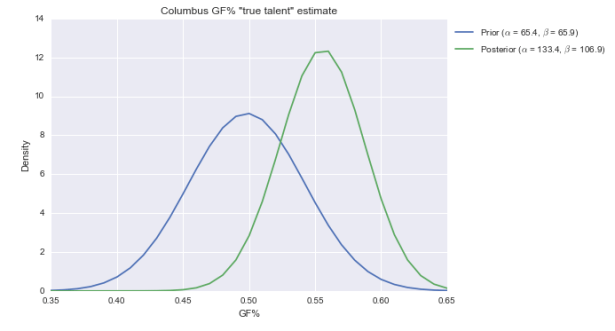
The posterior for GF% is centered at just over 55%, and is pretty broad. While 55% is still elite, it’s not awe-inspiring like 62%. (Also note here is that the beta doesn’t fit the distribution of GF% that well; it should be narrower. That would put the new posterior between the prior and posterior above.)
A more informative prior
As I said above, we can make priors arbitrarily complex.
Now, we know Columbus was below-average in 2015-16. So maybe drawing them from the distribution of all teams flatters them a little. Maybe we should use a prior derived from other below-average teams.
I created distributions based on the 42 teams that, since 07-08, in their previous season, were within two percentage points of Columbus’ 2015-16 CF%, and also within two percentage points of Columbus’ 2015-16 GF%. (I could have been fancier, and it would have been helpful so as to have more teams than just the 42, but this post is more for illustrative purposes of the technique than for accuracy and precision.)
Here are the CF% graphs.


I added the prior and posterior from above in dashed lines. There’s not much to see here–while our prior is a little further to the left now than before, the posterior is pretty similar.
How about GF%?
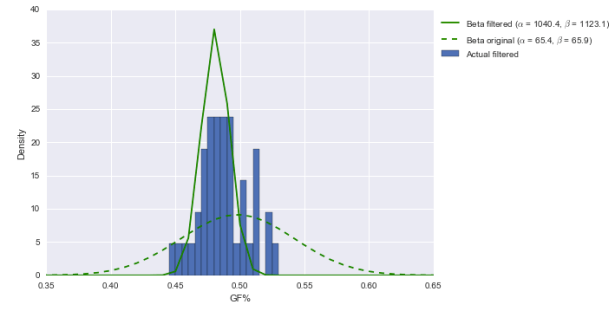
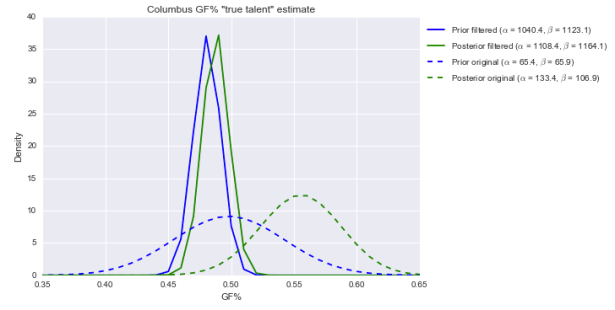
This is totally different. Our prior is centered further to the left now than before and is much narrower; that means our posterior, compared to before, is now much further to the left and far narrower. In fact, the center is around 49%–not even an average 50%. Over 80% of the area under the solid green posterior is below 50%. (Note: the prior should be wider, which would probably push our posterior above 50%. Just not into elite territory.)
In other words, with this prior, Columbus still looks roughly average. Thirty-two games of running roughshod over the NHL doesn’t mean quite that much in today’s NHL, apparently.
Update: Take a look again at those parameter values alpha and beta for the “filtered” distribution on the right side of the graph. They’re over 1000 each. That implies that for this group, if you want to regress small-sample performance to get a more sensible estimate of “true talent,” you can add 1040 GF and 1123 GA. That’s insane.
The “original prior” parameter values (~60 GF and GA, or around 30-40 games’ worth of goals) are much more sensible. That said, the “original” posterior is still likely flattering to Columbus.
Conclusion
Incorporating our prior beliefs should, in theory, improve our predictions and analysis of what happens early in a season. Here, I do not demonstrate that Bayesian thinking helps, but rather what the results of a basic empirical Bayes estimation would be of one of this year’s biggest surprises, Columbus. With a prior derived from the set of all teams in the “Behind the Net” era, Columbus’ average possession numbers and otherwordly goal ratio appear to be indicative of a “true talent” average possession and elite GF%; with a prior derived from the set of teams that had similar CF% and GF% to Columbus last year, the Blue Jackets look like an average possession team with an average-ish GF%.
That’s a huge difference, and goes to show how much the prior belief can and should affect our interpretation of the evidence we observe.
Postscript: Columbus
Personally, I think Columbus falls somewhere in the middle. Given the coaching and my take on the talent on that team, I think Columbus is a tad closer to “below average” than “elite.” In more concrete terms, I think Columbus is around average in possession and may be slightly better in GF%. Slightly.
But I also remember that coming into last season, a lot of people were pretty high on Columbus. I also think it’s possible that they more talent than most people (including me) give them credit for. Combined with a coach who may have adapted to a new game, some developing young talent (like Alexander Wennberg, Zach Werenski, and Seth Jones), some undervalued offseason acquisitions (like Sam Gagner), and a very good goalie, maybe they’re legitimately a great team.
I’d just like to see them keep it up for awhile longer first.

Interesting research . I do feel there is also emotional focus and passion slightly a part of certain runs , there is an undocumented intangible element to “streaks” and “runs” . Harnessing such things could be new knowledge or like “using the force” . I noticed that in the past 30 years without much deep analysis teams that peak just before playoff time tend to do better and all stats are out , players must be aware of this and this has to affect they thinking and a coaches approach to strategy . I also noticed I high degree of chance in the game , weird bounces and unpredictable elements – these are more common in hockey than it appears on the surface . Some suggest also professional sports are controlled and are guided by outer influences as well which can effect the flow and consistency of a team (each team in the league) over time. In other words paid mercenaries and working with a team which in essence is a “pack” or ” family” each player may adjust pace and tempo based on that dynamic or have different roles with different juxtaposing of athletes ..
Great interesting research and thinking in this don’t see this that often . I try to enjoy the game in my own elementary childish ways , helps me see it’s just a game but I do force myself to simplify and hope no matter the talent of my team they can win on any given game and the less they are likely the more fun it is . Call me lover of the underdog but often that powerful passionate way can get tainted and misused as well
Also can you define “elite” teams ? Do you mean on paper collectively each individual player has solid consistent statistics? Or is it consistency over a few seasons ? Are injuries included ?etc. Reason was asking is ( though I never checked Bayesian model or compared stats more deeply ) top teams do get knocked out early in playoffs and yet seemed to have proven solid talents and legitimacy all year . So another question in fact is , are playoffs truly a second season and do they define any greatness relevance to winning consistently during the regular season . Many seem to judge mainly on the outcome of playoffs – but in essence it is almost like a separate tournament set apart from the stats of the regular season . A good question is why is that and how does that effect a teams abilities and talents collectively throughout a regular season
I don’t have a solid definition of elite, but there I used it in place of 55% (“…posterior for GF% is centered at just over 55%, and is pretty broad. While 55% is still elite…”)
As for top teams losing early in the playoffs, the best teams aren’t that much better than their opponents–over the regular season, an average team wins 41, and a great team wins 50. That’s a difference of about 1 win every 10 games, and series are only seven games long.
Keep eye on lightning to blossom late perhaps for a middle average team this year they have a decent goal diff. If you watch them play you can see the struggle compared to last few seasons but you also see a team that has great ability to strike suddenly and a team with great depth , they rarely cave in totally . So there is solid talent there not elite talent but it could be a thing like that comes together late , still luck talent and unity among them . Probably a few teams similar in the league .
* Correction = A lot talent ” (not luck )
Also would consider a few of these middle average teams potentially elite not based on wins or losses but subtly other stats …. Glad sports are not robots (yet?)