There are four takeaways I hope to show in this post:
- The amount of games a coach has in any given tenure with a team appears to depend more strongly on goal statistics than shot statistics
- Coaches are strongly incentived to coach their team to score goals
- Coaches whose teams give up many goals do not last
- These are all fairly obvious conclusions, but are worth proving
I’m interested in analyzing coaching statistics using the traditional shot and goal-based metrics that the community now uses to analyze hockey.
First, lets get the basics out of the way. All of this data was downloaded from War on Ice or researched from various news websites, hockey blogs, and Wikipedia. I sanity-checked the research aspect of the data, but there’s always the possibility of human error. The on-ice data is all regular season, score-adjusted, and in 5v5 situations only.
The data I’m writing about today are:
- Head Coach (unique)
- Team
- Season
- Shots For %
- Goals For %
- Shots For per 60
- Goals For per 60
- Shots Against per 60
- Goals Against Per 60
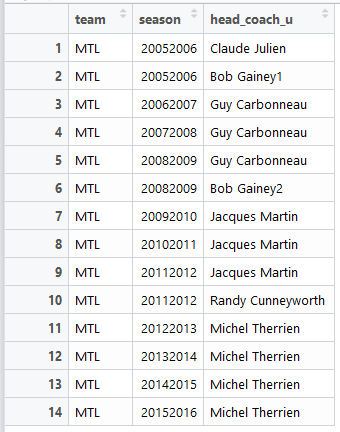
What is a unique head coach? Well, some NHL teams are very environmentally friendly. They prefer to reuse head coaches. For example, Bob Gainey coached for Montreal during two distinct periods of time. Bryan Murray, Lou Lamoriello, and Jacques Lemaire have also coached for a team in this manner. For the purposes of this analysis, I am treating each distinctive coaching period as its own entity. The table below shows Montreal’s coaches:
Let’s look at some basic statistics about how long coaches last in any given tenure. From 2005-2016 (regular season, excluding the 2012-13 lockout-shortened season), the mean games coached for any unique head coach was 175. That’s just over two full 82 game seasons. The median was 162, which is just under two full seasons. The most common number of games coached was 82.
This is the distribution of games coached in a tenure, including the 2012-13 season:
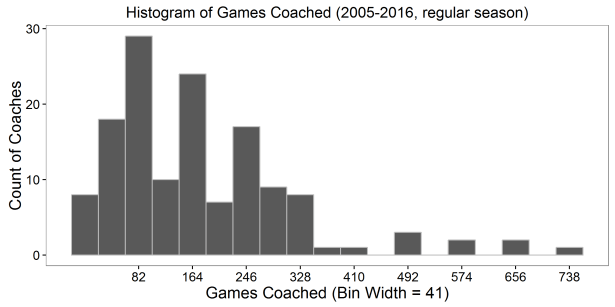
The data is grouped around the 82/164/246 marks because most coaches make it to 82 games in a full season:
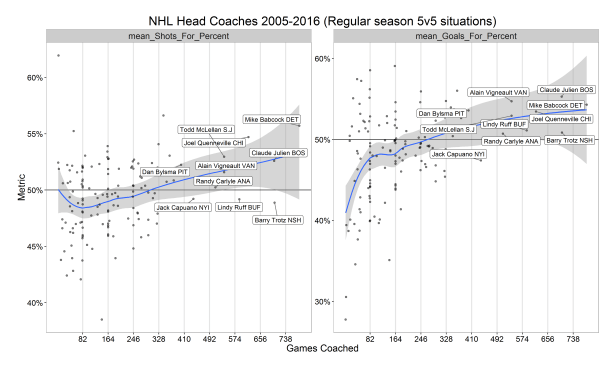
One salient question is, how do shot and goal metrics relate to how long a coach stays in any given tenure? Looking at 5v5 data:

There appears to be a pretty clear trend upwards in both graphs, indicating that coaches whose teams tend to dominate the shot and goal percentages tend to have longer tenures. The top 5 coaches in games coached are labeled. Jack Capuano’s time with the Islanders falls outside the trend in both instances, which is curious.
Looking at shot and goal rate statistics for, the trend is still upwards, but it is not as striking:
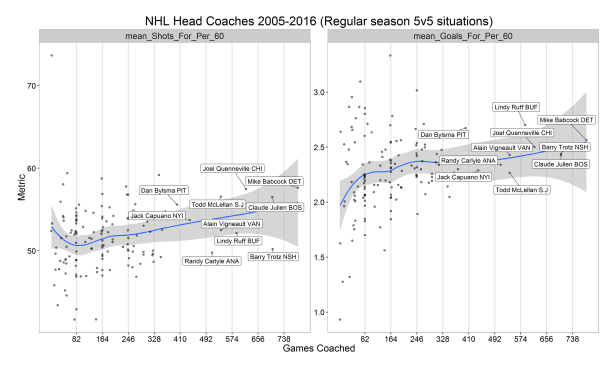
There appears to be significant pressure for coaches to get their team to score goals (not at all surprising). There are no coaching tenures of more than 5 seasons where the team averaged less than 2 goals per 60 minutes. That trend does not appear to apply to shots.
Looking at the shots and goals against rate statistics:
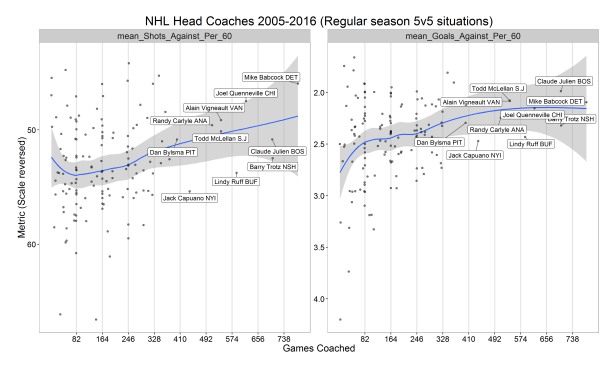
Note that the Y axes have been reversed to maintain the “higher is better” convention. Coaches seem to be able to get away with high shots against rates. The outliers in the shots graph (below the curve) are farther away from the curve than the outliers in the goals graph. Coaches whose teams give up many goals do not last in the league.
In each of the 3 graphs above, it appears that “games coached”, as a statistic, reacts more strongly to changes in goal statistics than shot statistics. This is not surprising, given that goals are the currency of the game, and have been the sole focus of analysis in management for most of the sport’s lifetime.
While these conclusions are not groundbreaking, I think it is important to establish some basic observations about coaches before moving forward. I’ll be releasing the data behind these graphs, so hopefully the community will add to the discussion. @DTMAboutHeart has already done some work with the data. Again, thanks to War on Ice for providing the data and being a great resource over the years.
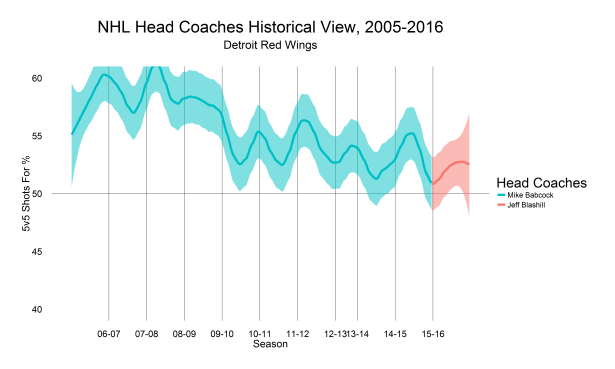
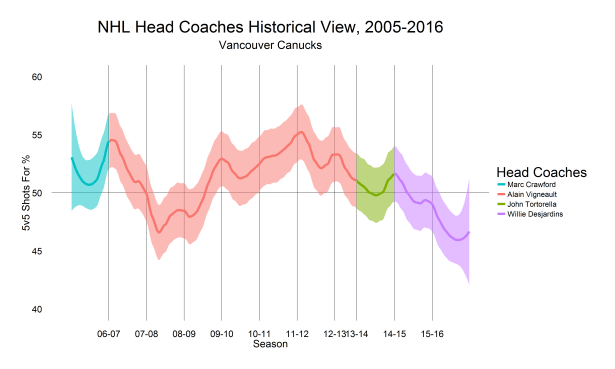
As a teaser for my next post, I attached the following graphs that I presented as a poster at the Rochester Hockey Analytics Conference (shoutout to Ryan Stimson and Matt Hoffman for organizing such a great event). I’ll be writing about these and similar graphs in the future.