
Luca Sbisa may be one of the players who best epitomizes the divide between the old-school, eye test view on hockey and the statistics-focussed analysts offering their opinions from their mother’s basements on fan curated sites across the internet. While GM Jim Benning clearly thinks Sbisa is a useful defender, rewarding him with a 3-year, 10.8MM deal, and consistently praising his defensive zone smarts, Canucks fans have been less bullish on the talents of the 25-year-old Swiss pointman. Correctly noting his less than stellar possession numbers, J.D. Burke commented that his first season with Vancouver featured few “extended stretches in which any pairing with Sbisa on it looked passable”. These aren’t just the criticisms of a bitter fan wishful for better years, Burke backed up his arguments with a detailed numerical breakdown of Sbisa’s many failings, and video evidence of some of his less than professional defending from 2014-2015. Burke, and the Canucks’ fanbase in general, seemed to paint a picture of Sbisa that stands in stark contrast to what Vancouver management observed. Where the fans saw a player who frequently found himself out of position at critical junctures when defending his own end, Vancouver’s brain trust viewed Sbisa as the ideal player to disrupt a cycle down low. How could two groups of people who watched the same games with such intense devotion come to such different conclusions?
One of the biggest difficulties with evaluating Sbisa, and defencemen in general, is that what the eye test says is important is often wildly out of sync with what statistics can currently measure. While stats-based analyses focus on a defender’s ability to prevent shot attempts (in other words, their Corsi Against per 60), most of the praise for defensively-minded defencemen tends to focus on hockey IQ, being in the right position, and winning battles in the corner. While ideally these less “quantifiable” skills should lead to favourable statistical results, issues with differences in player deployment and the teammate-dependent nature of defending often mean that what gets praised in post-game interviews isn’t what shows up on the scoresheets, leaving a divide between management’s view and the story told by pure shot attempt numbers.
One of the more innovative approaches to measuring defensive impact came from Tyler Dellow, now of the Edmonton Oilers. Back when his writing was still publically available, Dellow had a great series of posts looking at what he termed “multi-shot shifts” which measured how frequently a player allowed multiple shots against on a given shift. The idea (or my best recollection of the idea, at least) was to identify players who were able to regain control after a negative play in their own zone (the first shot against) and prevent further damage from occurring.
While Dellow’s original methods are no longer accessible, we can build on his ideas to create new metrics that give us a better sense of how defencemen are actually contributing in the defensive end. We’ll start by dividing up all shot attempts into two categories:
- Initial Shot Attempts, which are the first shot attempts that occur following a shift start or faceoff; and
- Follow-Up Shot Attempts, which are all the other shot attempts that occur between an initial shot attempt and a shift end or stoppage.
The reason we want to break down shots this way is that, in theory at least, measuring follow-up shots should give us a better sense of how defencemen are able to handle themselves when we know they’re being forced to play defence (since they’ve already given up a shot against). Looking at the period following an initial shot on its own should help us isolate a defenceman’s ability to re-establish order in their own zone, win puck battles after a save, and get the puck out of their zone and away from harm.
Another benefit of separating these stats is that it can help remove some of the effects of zone starts from a player’s results. While iSAA60 will be more heavily influenced by deployment, follow-up shots are mostly dependent on a player’s own play after a shot attempt, and thus should reflect their individual defensive abilities more than the situation they’re playing in.
We can turn each player’s total initial and follow-up shot attempts into a rate stat by dividing a player’s ice time into two buckets:
- Initial Shot TOI, the time between the start of a shift or a faceoff and the first shot attempt that occurs (or the end of the shift, for shifts with no shot attempts); and
- Follow-Up Shot TOI, the time between the initial shot attempt and the end of a shift or the next stoppage.
This will give us each player’s Initial Shot Attempts Against Per 60 (iSAA60) and Follow-Up Shot Attempts Against Per 60 (fSAA60). Each of these stats tells us a different story about a defenceman’s performance – iSAA60 can measure things like how well a defencemen protects their blueline or is able to keep skaters to the outside on the rush, while fSAA60 should give us a sense of how well they recover after a shot attempt and whether they’re able to establish defensive possession in the scramble following a save.
The easiest way to see the difference between our two measurements (and to verify that they are measuring distinct abilities) is by plotting a defencemen’s iSAA60 versus their fSAA60. By looking at both numbers together we can identify individual strengths, and determine what aspect of a player’s defensive game is driving their shot prevention ability (or lack thereof).
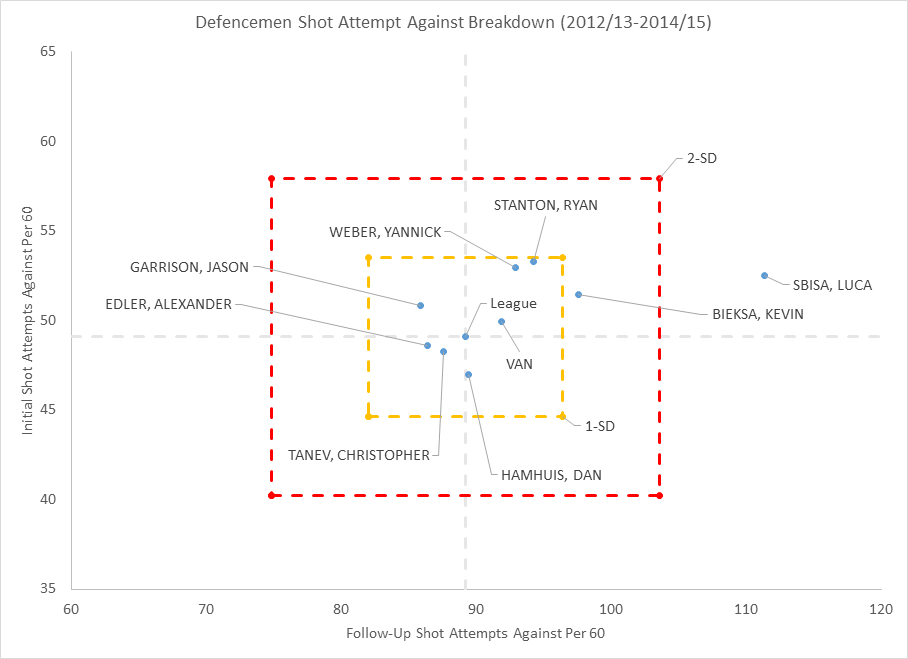
When we plot out the Canucks’ defensive results over the last few years we see that not only has Luca Sbisa been bad, he’s been in a world of his own when it comes to follow-up shots with the ‘Nucks. The chart above has both the league average (grey dotted lines) plotted, as well as boxes showing how far 1 standard deviation from the mean is (we’d expect to see 68% of players inside the yellow box), and how far 2 standard deviations are (we’d expect to see 95% of players inside the red box). Sbisa has quite clearly been terrible because after he gives up a shot against, his opponents tend to pile on even more. He was more than 2-standard deviations worse than average by fSAA60 on a team that, as a whole, wasn’t all that prone to giving up follow-up shots. It’s also notable that Sbisa’s defensive deficiencies seem to be limited almost entirely to giving up follow-up shots. While he allowed roughly the same rate of initial shot attempts as Kevin Bieksa, Yannick Weber or even Jason Garrison, his fSAA60 total was nowhere near theirs – the Swiss pointman was simply lost once opponents established possession in the Canucks’ end.
While Sbisa’s ratings disagree with the eye test (or Jim Benning’s eye test, at least), there are actually some players whose fSAA60 results align better with the “traditional view” than possession metrics might suggest. Outside of the Erik Karlsson-Marc Methot pairing, the Ottawa Senators blue line has been more or less a disaster from a possession point of view in recent years. And although General Manager Bryan Murray has often insisted that his defensive unit doesn’t need work, the Sens have struggled to prevent shots against at 5v5 over the last several campaigns, sitting 29th this year in CA60 after finishing 19th in CA60 in 2013-2014 and 18th in 2014/15.
When we look at the Sens’ defensive results from a follow-up shots point of view, we see a bit of a different picture from what standard CA60 might show. Eric Gryba and Chris Phillips, two players often heralded as prototypical “shutdown defencemen”, both seem to handle themselves well in their own end following shot attempts. Though each blueliner has struggled to prevent the initial shot against, it’s important to note that allowing a higher quantity of initial shots against is likely a product of the style of game the Sens have adopted over the last few years. Ottawa has often played an up-tempo approach built on trading opportunities, and hoping to score on transition shots, which has likely lead to a greater quantity of initial shots against than most teams usually see.
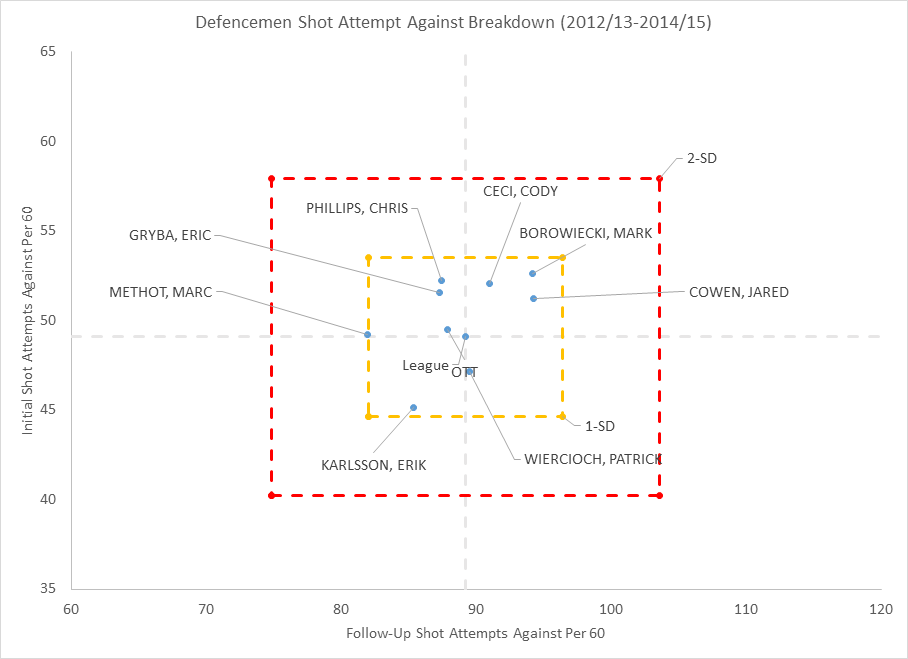
At the other end of the spectrum, there are still two “defensive” defencemen who look terrible by fSAA60: both Jared Cowen and Mark Borowiecki have performed much worse than their teammates and the league average over the past 6 years. These are also players who, for the most part, fail the eye test as well, running around in their own end and generally playing what can most kindly be described as a chaotic form of defence. While these are just a few illustrative examples, it does appear that our new stat captures some of the vaguely defined defensive intelligence that many GMs seem to value.
What’s arguably the most interesting thing about fSAA60 (from a statistical point of view) is that it appears to be just as repeatable as iSAA60, even though the sample size for fSAA60 is less than a quarter as large as that of iSAA60.
| Statistic | Year-to-Year Correlation |
| Shot Attempts Against Per 60 (SAA60) | 0.48 |
| Initial Shot Attempts Against Per 60 (iSAA60) | 0.33 |
| Follow-Up Shot Attempts Against Per 60 (fSAA60) | 0.32 |
Although most players see only 20% of their total TOI come in “follow-up time” (i.e. 20% of their ice time is after a shot attempt against), and 27% of their total shot attempts classified as follow-up shots, fSAA60 shows just as much year-to-year persistence as iSAA60. In other words, there’s just as much “talent” observed in 25% of the data, suggesting that a defender’s control over the number of follow-up shots he allows is much greater than his influence on the number of initial shots against.
This, of course, makes sense: initial shots against are influenced by a broader array of factors, including zone starts, his forward unit’s ability to pin opponents in, and the effort of his backcheckers. Many of these variables are outside of an individual defenceman’s control. In contrast, follow-up shots against are determined by factors that a blueliner can actually influence: keeping opponents away from rebounds, recovering pucks from in front of the net and in the corners, and starting the breakout to move the puck up the ice. While neither stat is 100% under the control of one defender, it’s easy to imagine that a majority of the plays leading to a follow-up shot might occur in areas where defencemen are asked to protect.
In spite of everything we’ve gone over here, evaluating defensive play is still quite difficult. Playing defense requires five players to act together as a unit, and even one screw up can lead to a quality chance for an opposing shooter. Breaking play down into more granular segments can help detect unique skillsets that certain players might possess, and can potentially help identify potential tactical improvements for teams as a whole. While the debate over what makes a good shutdown blueliner is likely to continue, new metrics such as fSAA60 can give us the means to test some of these broad labels, and provide a baseline to evaluate players whose best skills don’t exist at the offensive end of the rink.

Would there be a use to repeating this experiment for forwards, looking at who can and cannot sustain offense? By my logic, recovery after a shot attempt would be just as important offensively as it would be defensively.
Can I see this for this year’s rangers or for this year and last year combined?
excellent work! Matt! Is it possible to see Matt Barkowski (last yr Boston) and this yr with Canucks Benning has also been high on his abilities again in stark contrast to fanbase AND
often has been paired with Sbiza in what many feel is a nightmare pairing! Thx