

“2008 NHL Entry Draft Stage” by Alexander Laney. Licensed under CC BY-SA 3.0 via Commons.
Identifying future NHLers is critical to building a successful NHL team. However, with a global talent pool that spans dozens of leagues worldwide, drafting is also one of the most challenging aspects of managing an NHL team. In the past, teams have relied heavily on their scouts, hoping to eek out a competitive advantaging by employing those who can see what other scouts miss. Quite a challenge for many scouts that may only be able to watch a prospect a handful of times in a season. While there has been some progress in the past few years with teams incorporating data into their overall decision making, from the outside, the incorporation of data driven decision making in prospect evaluation has been minimal.
To address this, Josh Weissbock and myself have developed a tool for evaluating prospect potential which we call Prospect Cohort Success (PCS), with the help of others in the analytics community including Hockey Graphs Supreme Leader, Garret Hohl.
The underlying theory behind this system is that if you assemble a cohort of the closest comparable peers to any given player, using the variables we know to be statistically significant for draft age players in the Canadian Hockey League (age, height, points per game), that cohort peer group can be inform what type of career we can expect that prospect to achieve. For example, a 6’0, 17 year-old forward who scores at a 1 point per game rate in the WHL, has almost 600 close peers, of which 22% went on to play over 200 games in the NHL. The PCS for this player would be 22%.
Early results from this process were presented by myself at the DC Hockey Analytics Conference in April and were very encouraging. We have made significant strides since this presentation, namely utilizing Euclidian distance to more precisely identify the players who are the closest match in terms of the four key variables (age, height, points per game, and league), and we have also been able to adjust for different scoring rates in different eras. The purpose of this post is to disclose the results of the current iteration of PCS – lets call is PCS 1.0 – to set a baseline as we make additional improvements to the model in future versions.
As part of this review, we assessed players from all leagues that contributed a significant number of NHLers (CHL leagues, Euro Elite leagues, NCAA, USHL, Euro U20 leagues, and Canadian Junior A leagues) over the period of the 2000-01 season to the 2010-11 season. We’ve also included players who attended major international tournaments, such as the Ivan Hlinka and World Junior tournaments (International Junior Tournaments).
The table below details the number of players from each league assessed which played either 100 or 200 NHL games:

This table shouldn’t come as much surprise. As we can see, there are a number of leagues (WHL, OHL, QMJHL, USHL, SHL) that are providing a large volume of NHLers. Also of interest is the large number of players from international tournaments, which makes a lot of sense intuitively. If they have been selected to represent their country internationally, they likely have a higher chance of making the NHL than their countrymen who are not named to the national team. This is also likely a reflection of the focus scouts place on international play.
The table below details the percent of players from each league that went on to play 100 or 200 NHL games:
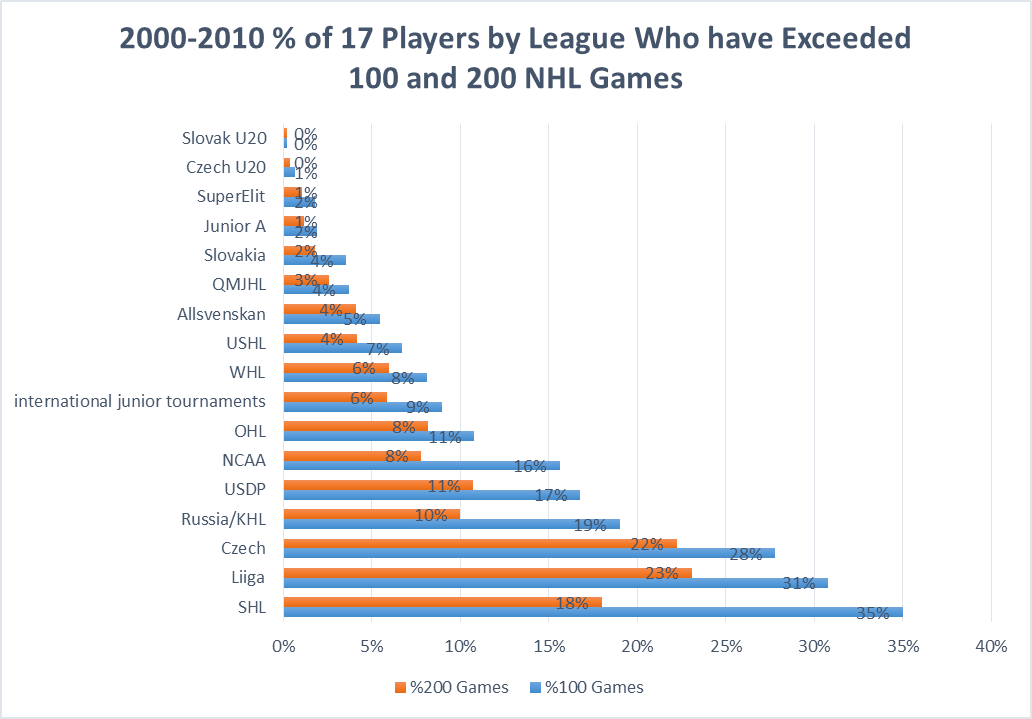
We also see a number of leagues that provide NHLers at a very high rate (SHL, Czech, Liiga, Russia/KHL), which is a trend I identified previously, finding a high NHL success rates among 17 year-old players who managed to crack European Elite league rosters. Following a similar train of thought, players that earn a spot on the USDP roster, play in the NCAA as a 17 year old, and/or represent their country at the international level at 17 deserve special attention from scouts as well.
To assess how well our PCS model performed, we ran separate mulitvariable regression models by league in order to assessing how well PCS predicted NHL games played, as compared to how well age, height, and points per game predicted NHL games played:

Assessment of Results
As we can see, PCS had a statistically significant p-values in all leagues, with the exception of Allsvenskan, Slovak U20, and the Slovakian Elite league. We note from the graphs above that none of these leagues contributed a significant number of NHLers during this period (7 total), this is probably more a reflection of the small number of players from these leagues who went on to successful NHL careers than it is a refection of any inherent flaws with the PCS methodology.
With respect to the regressions performed using height, age, and points per game, we see an interesting trend in that height does not appear to be statistically significant for a number of European Elite leagues (SHL, Czech, Liiga, Allsvenskan). This is consistent with prior work performed by Garret at the NHL level, where he found that when looking at just NHLers, height was not statistically significant when predicting NHL points per game. The lesson makes intuitive sense – once a player has established themselves as a player at the NHL or European Elite league level, their height is no longer relevant.
With respect to age, in all cases we see that age was statistically significant, with the exception of international tournament and USDP players, which makes sense as these teams are made up of players of very similar age, so this variable doesn’t separate players as much as it would in leagues with larger ranges of player age (ie CHL leagues and Euro Elite leagues).
In terms of the R square values, we see a very encouraging trend, in that PCS v1.0 explained more of the variability of the response data (NHL games played) than a regression of age, height, and points per game, for a number of leagues that contribute roughly 80% of NHLers (CHL leagues, NCAA, USHL, SuperElit). While issues identified through this analysis warrant additional consideration in terms of the measures we value, and how we weight these measures for some leagues, we can feel pretty confident in the leagues where PCS managed to outperform the traditional regression. Here are the graphs representing forward and defense PCS versus games played and points
Forwards


Defensemen


As we can see, PCS has a stronger correlation with both NHL games played and points for forwards than defensemen, which seems to confirm the theory that drafting defensemen, especially earlier in the draft is inherently riskier than selecting forwards.
PCS continues to be a work in progress, and we look forward to incorporating the lessons learned through this process in further refining future iterations. That said, we believe the findings thus far are exciting and represent the most promising and expansive analytical research in the area of hockey prospect evaluation currently available in the public sphere.

Fantastic. Do you plan to release a UI so that members of the public can run the PCS on all of their prospects?
At this point in time, no. But maybe that’ll change in the future.