
The other day, @Moneypuck_ and @SteveBurtch had a conversation about the Prospect Cohort Success Model:
https://twitter.com/SteveBurtch/status/638216552085635072
https://twitter.com/SteveBurtch/status/638216835679277056
https://twitter.com/SteveBurtch/status/638217390518632449
While the PCS model is interesting in its own right, I found the discussion about the methods we use to analyze players to be interesting as well.
The above conversation shows that the same player can appear differently depending on which metric is used. Burtch seems to argue that Orr’s accumulation of games played is misleading, since he apparently did not play much in any individual game.
Justin Bourne touched off a Hockey Twitter maelstrom with his tweets regarding rate metrics. I don’t want to unfairly castigate Justin here, but it’s clear that there is still some disagreement in the hockey community on how to measure player production.
Rate metrics are one of the many innovations of modern hockey analysis. Analysts have begun to substitute them for traditional point totals. Point totals ignore one of the most important drivers of production: opportunity. Skaters play different amounts of games in a season, and skaters can be allotted different amounts of time within those games.
Doing the math quickly, if Skater A scores 60 points in 82 games, that’s a .73 points per game (PPG) rate. If Skater B scores 55 points in 70 games, that results in a .78 PPG rate. Skater B clearly produced at a higher rate, but you wouldn’t see that using point totals alone.
We can further investigate the amount of opportunity that players receive using time on ice (TOI). Assume that Skater A played 20 minutes a night and scored 60 points in 82 games. That would be a 2.2 Points per 60 minutes pace ((60 points/1640 minutes)*60 minutes). If Skater B played 15 minutes a night and scored 55 points in 70 games, he would perform at a rate of 3.14 Points per 60 minutes pace ((55 points/1050 minutes)*60 minutes).
Skater A scored more total points in more total games, but Skater B performed at a higher rate with less opportunity. Perhaps Skater B could surpass Skater A’s point totals with more TOI per game (TOI/Gm).
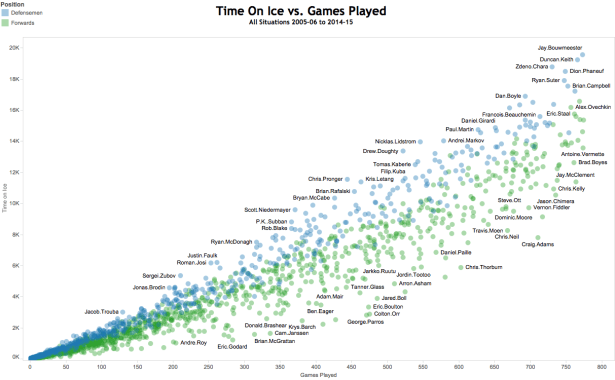
The variance between TOI and GP increases as you go up and to the right. The clear takeaway from this graph is that TOI and GP do not increase in lockstep with each other. If there was no variation in the distribution of TOI within games, TOI would increase solely as a function of GP. If that were the case, we would see a straight line. Instead, we see a curved line with increasing variance as GP increases.
We can see that there are players whose TOI lags behind where it should be if you assume a uniform distribution of minutes. Grinders, defensive specialists, and enforcers (Chris Neil, Craig Adams, and Colton Orr), and defensive defensemen (Corey Sarich, Tim Gleason, and Anton Volchenkov) are examples of players whose TOI lag behind their GP.
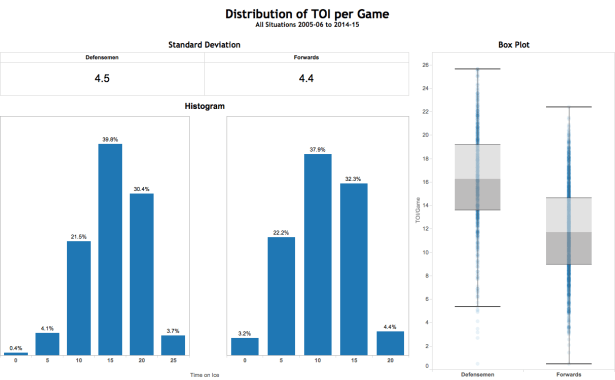
This graph shows that Time on Ice Per Game (TOI/Gm) is not tightly distributed around the mean (though the distribution does not vary much across the two positions). This means that there are wide differences in how many minutes skaters can play in a game.
Looking at how TOI interacts with Points and Points per 60 (P60), it’s clear that how many Points a player accumulates is heavily influenced by how much TOI they are allotted. The direction of the slope holds for each position, but the effect is stronger for forwards. The higher R^2 values indicate how much the metrics are correlated with each other. The R^2 value of .92 (0-1 range) indicates that TOI and Points (forwards) are deeply connected, while the relationship between P60 and TOI is much weaker.
 TOI/Gm also affects both Points and Points/Gm, though less so than TOI. The same pattern holds here as well.

If you argue that TOI is not worth adjusting for, you are arguing that there are not significant differences in player TOI/Gm. This is clearly not the case. Furthermore, that position would need to hold that TOI allocation does not affect point production. That is also not supported by the evidence.
I think it is clear that TOI is the superior metric to standardize player performance against because it is sensitive to the varying levels of opportunity that players experience within individual games. While it does not control for other factors (zone starts, quality of teammate, score situation deployment), it is an incremental improvement well worth using. Point totals do not control for any of these variables. It’s time to move on.
I created an interactive viz in which you can explore the data further.
Data from War-On-Ice
