

Image Courtesy of WikiMedia Commons
The biggest incentive for teams to employ analytics is exploiting market inefficiencies. Whenever you can exploit an inefficiency in a market it gives your team a comparative advantage over the others. In other words, you raise your team’s chances of being a successful club.
I took a look at previous work from Eric Tulsky and Michael Schuckers on draft pick value and used them to show how one may use statistical analysis to take advantage of market inefficiencies.
Let’s take a look.
Eric Tulsky, now of the Carolina Hurricanes, previously looked at the cost in picks to obtain other picks. This valuation of draft selections essentially shows the perceived value of different draft picks.

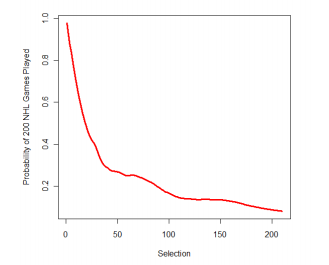
The graph ends at 100, although there is data extending all the way to pick 210. It just becomes so small that the differences are negligible.
Michael Schuckers, on the other hand, looked at draft pick value from a different angle. What Schuckers did was use probability of draft success to create an estimate for a pick’s “true value.”
Indexing both sets of data relative to a first overall selection, we can then compare how the perceived expected value of a draft selection differs from the “true” expected value.

The shapes of the curves are similar but there is a far steeper drop initially in the perceived value derived from the trade market relative to the true value derived from the expected success rates.
Next we looked at the rates of change between both functions (using delta rise over run between two points, not differentiation).

It may be hard to view, but the two lines intersect between the 4th & 5th pick and then around the 24th pick. After the 24th pick the lines quickly intersect once again and stay separate until the 40th selection where they become increasingly more similar in value.
What does all this mean?
At first the trade value of top four selections is much higher than the derived value in becoming a NHL player. This makes sense as the top picks come at a premium. These are your potential star and franchise players and there is an added cost to those players due to an additional source of value outside of their success probability.
After the top four picks the trade value begins to severely slow down in its devaluation, more so than the expected true value.
Between the fourth and 40th selection the “true” expected value of a draft pick diminishes less than trade value diminishes.
Then after the 40th overall pick the two devalue at a similar pace.
Being able to look at patterns in valuation and learning how to exploit these patterns can help a team increase their chances in successfully improving their team.
Hockey, drafting, and trading is about probability. No matter what a GM does, there is always a chance that the product of a move or selection unfolds in an unfortunate (or fortunate) manner rather than what was most likely.
Of course, markets can change. As inefficiencies become common knowledge and there is a shift to exploit them, the comparative advantage disappears.
All relationships are shaped by the environment they exist in at the time.
