
Goaltending is a devilishly difficult thing to predict at the best of times. In smaller samples, even the most powerful forecasting tools fall victim to variance and luck. Playoff performances, and to a greater extent single series, represent such samples and we’re frustratingly inefficient at predicting them using traditional methods. I’m excluding more refined models such as @Garik16’s Marcels, which may very well do a better job of it. I compared regular season 5v5 Sv% over different intervals of time, both total and strictly on the road, for all playoff goalies over the past three seasons and how they matched up with playoff 5v5 Sv%. Here are the results:
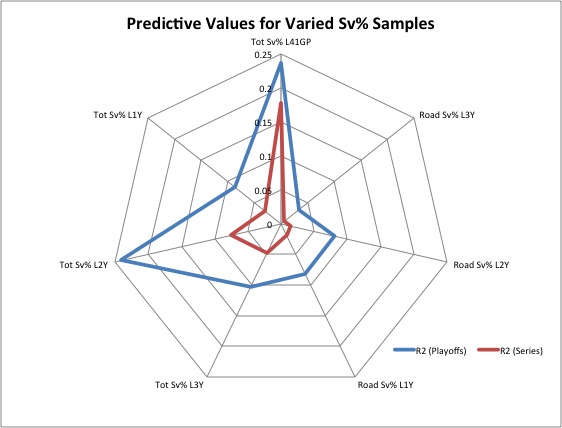
Evidently, limiting Sv% samples to games played on the road did not offer better predictive value. Total 5v5 Sv% over the prior two regular seasons did the best job of predicting total 5v5 playoff Sv%, while 5v5 Sv% over the last 41 regular season games was far and away the best at predicting single series. It’s interesting to note that in both cases, the goaltender’s final 41 GP far surpassed the entire regular season in its ability to predict postseason performance. If the word “momentum” leaves a sour taste in your mouth, call it something else. Over the last two full seasons though, performance in the games leading up to the playoffs did seem to carry over quite well.
Categorizing the data according to the number of series in which the goaltender played four games or more yields the following trend:
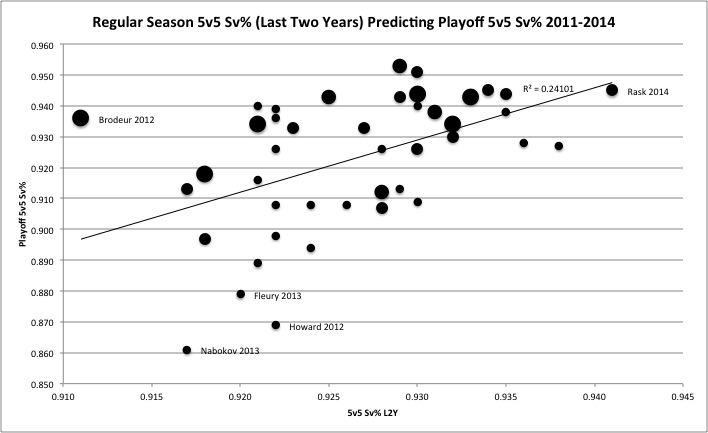
Where size is proportional to series played in a postseason. The larger points congregating above the trend line indicate the goalies who went deep into the postseason performed above their expected 5v5 Sv%. The doctrine that you can’t win the Stanley Cup without a little luck is as old as the trophy itself, and this is further proof.
Note that Pearson’s R coefficient for our best predictor is still relatively small. Shedding goalies who appeared in only one series bumps it up to .246, but there’s still a great deal of noise.
In order to visualize the spread in single-series save percentages, I plotted each series against five groups of regular season 5v5 Sv% L41GP:
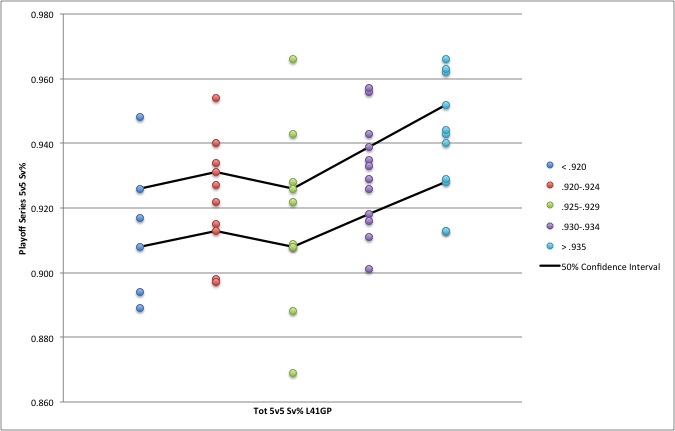
The 50% confidence interval describes the range of Sv% that contains at least half of the data about the mean. Because each grouping contains but a portion of the data, we need to expand to include all series in order to define proper intervals
Over the entire set, these were the intervals for corresponding levels of confidence:
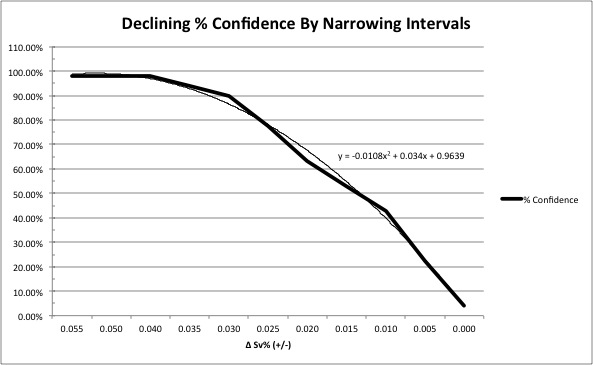
Approximating using the equation for the line of best fit, we get that the 50% confidence interval for single-series 5v5 Sv% is 1.35%. The 75% interval is 2.35%, meaning that in order to be reasonably certain of a goaltender’s performance over one series, you need to allow for a range of 5v5 Sv% that spans the entire spectrum between back-up and elite starter.
Over multiple seasons, you could make educated predictions on which team in a series match-up will receive better goaltending based on their starters’ 5v5 Sv% over their last 41 GP and be right more often than wrong. The inherent randomness in goaltending performance, though, makes for a very modest advantage. When Jonathan Quick then out-performs Henrik Lundqvist over the course of a five game series, look not to explain the fact with narratives of “clutchness” or “timely saves”. It is, quite simply, a thing that happens.
