

Photo by “Djcz” via Wikimedia Commons
I don’t think we engage the idea of the place in history that many of today’s best players hold, and I partly attribute that to the difficulty of finding points of comparison across generations. Simply using raw scoring data doesn’t do the best job because a.) everyone knows Gretzky wins, and b.) we know that scoring fluctuated drastically in the 1980s, and it wasn’t because all the best shooters and passers were playing then. With that in mind, I’ve stewed over ways to bring these different generations together, in such a way that we can be comfortable comparing them. It’s led me to build a couple of metrics that move a little bit away from the counting statistics (G, A, PTS) and towards some metrics that demonstrate a player’s share of their team’s results.
The two metrics I’m focusing on for these young guns both relate to offensive measures, but I think that generally they also allude to a player’s importance to play overall. I tend to agree with Vic Ferrari’s assertion (see his third comment here) that forwards and only a select number of defensemen play much of a role in driving offense, and recalling some of the player types implicated in Steve Burtch’s work over at Pension Plan Puppets on Shut-Down Index, I’d propose that players that drive possession (forwards and defense) more generally will return some signals in regards to shooting or playmaking. Whether that simply means, in the future, we’ll get more from simply looking at passes and shots (or robots will do the whole darn thing and save me the trouble), I can’t say. For now, though, I created %TSh, or percentage of team shots, which expresses the proportion of team shooting a player does (in games they played), and %TA, which does the same exercise with team assists. While the issue of whether this expresses positive possession players is ripe for debate, it’s indisputable that players strong in these metrics will be drivers of offense for their teams.
In that spirit, I wanted to delve into some nifty historical data; I’ve been able to go all the way back to 1967-68 with data on %TSh and %TA, and it returns some fascinating studies on NHL legends vis-à-vis today’s stars. For this piece, I’m focusing on the players that get everyone excited, so-called “young guns,” or players under 25 that have already demonstrated their ability at the top level. How do contemporary young guns measure up all-time?
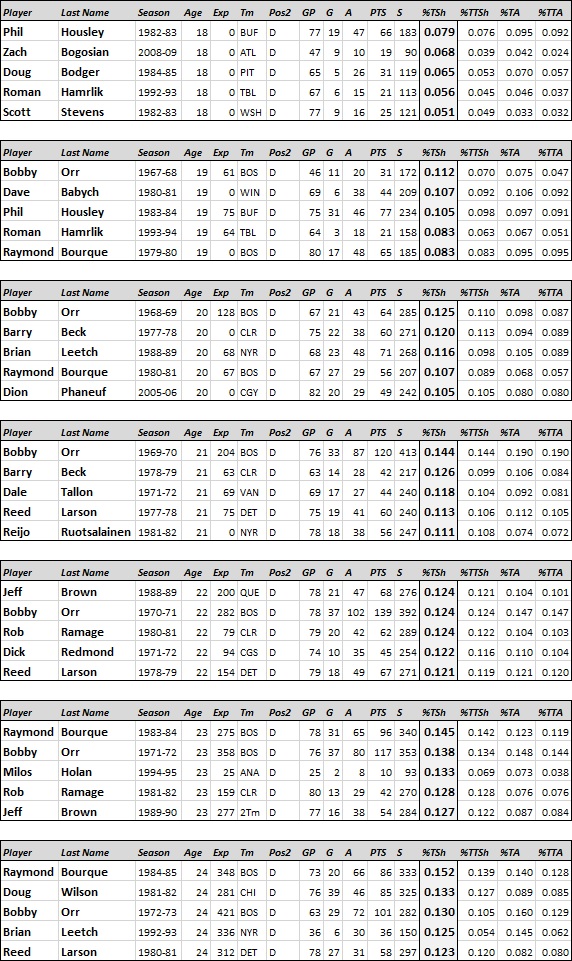
To do this, I first of all wanted to break player seasons into “buckets” by age; my data (thanks to Hockey Reference) includes player age, which is determined by their age by February 1st of the particular season. I further separated them into defensemen and forwards, as forwards’ roles in offense give them higher returns in both metrics (though defensemen do put up a fight). To kick it off, we can look at the greatest young gun forward shooting contributions (cut-off is at least 20 GP):

I added some helpful additional metrics, including “Exp” (number of games of NHL experience leading up to that season), “%TTSh” (percentage of Team Total Shots that season), and “%TTA (percentage of Team Total Assists that season). So, while %TSh and %TA are focused on the games a player played, %TTSh and %TTA are focused on contribution to full-season results. With that explained, your young gun defensemen shooting contributions:
Any NHL history junkie will love some of the names that jump out here. Ovechkin is pretty obviously a shooting legend; Paul Kariya was the only guy who could hold a flame to him. I can’t really describe to you how much I enjoyed seeing Pavel Bure and Teemu Selanne break into the league…but I’d say the level of excitement around them certainly rivaled Ovechkin & Crosby. People want to point to the 1980 U.S. Olympic Team as breaking stigma of U.S. players, but Housley’s massive success right out of high school possibly did more. Bobby Orr obviously commands the defensemen list; I’ve said in the past that he didn’t really revolutionize the role of defensemen, because he’s surpassed everyone before and after him. Even Milos Holan. Moving on to %TA:
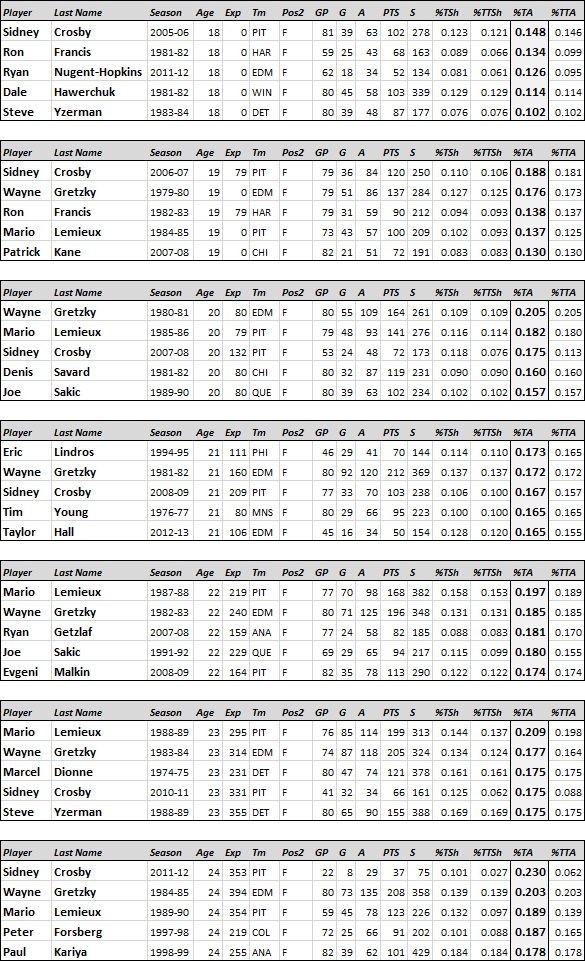
Gretzky was an extraordinary talent, but about 50% of those Oilers teams were extraordinary talents all together. Crosby, on the other hand, was immediately tasked with a terrible (and terribly old) team, a not-ready-for-primetime Marc-Andre Fleury, and a couple of godawful coaches (Eddie Olczyk, Michel Therrien). And he’s been excellent, and is excellent. Defensemen:
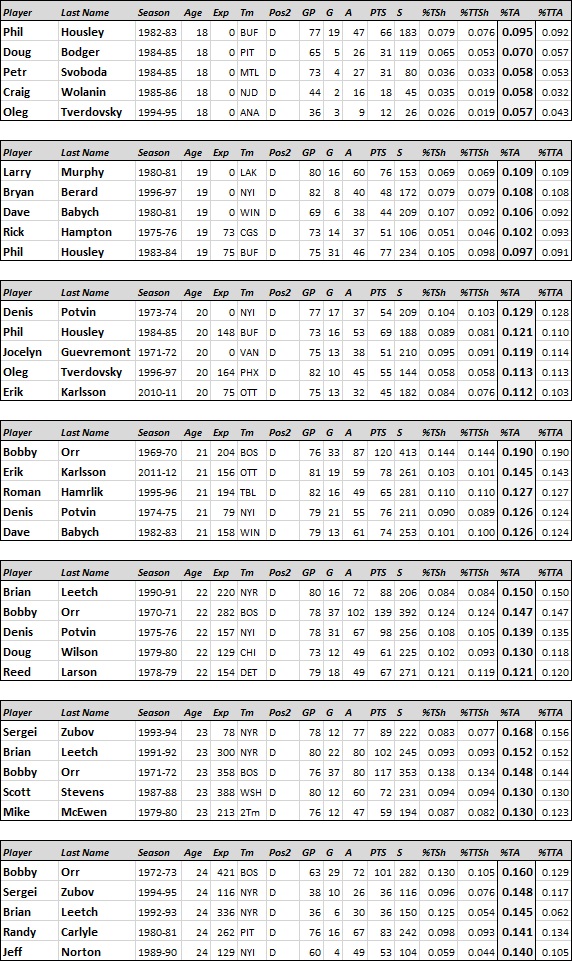
Once again, with emphasis: Bobby Orr.
Metrics like %TSh and %TA can bring us closer to satisfactory comparisons of players in different eras, but they obviously have their limitations. What does it mean to contribute a lot to a poorer team? I’d argue it means a lot, if the end game is that you produce shots and set people up at very high rates. One last point worth making; we see a good number of today’s stars dispersed among these lists, but let’s put this in perspective: today’s game is much more difficult to play than those of the past. Crosby and Ovechkin would have seemed supernatural in the 1980s NHL…well, I mean, beyond their normal supernatural tendencies. That being said, this is just one of many interesting exercises we can do with these historical metrics.
Feel free to use the comments to inquire about other players’ %TSh and %TAs in NHL history.

The “Exp” on a couple of the guys is a little wonky; I caught a tick in the formula I was using for that after the fact. Without checking too close, I know Kariya’s is off. Fixed in my dataset now.