

For quite some time there has been a debate going on: those who think you should add a defenseman’s effect on save percentage into player evaluations and those who think that adding such information causes more harm than good to the analysis. Note that this does not mean defensemen do not affect save percentage. That is an entirely different stance.
When it comes to evaluating a player statistically, you want the number to account for two things: effect and control. If a statistic does not help quantify how a player improves their team’s chance at winning, it is useless in measuring effect. If a statistic has too much white noise or other contributing factors that it would take too large of a sample to become significant to the player’s contribution, it is useless in measuring a player’s control over the effect.
Repeatability is how you determine control. If an outcome is generally considered good but players struggle to be consistently good or bad at it, then there is not much control over the number. Take for instance scoring; the best players at scoring tend to stay at the top of the league, while the worst tend to stay at the bottom. While there are exceptions to this, the general trend exists.
A game of hoops against your friend is a common analogy used with how repeatability demonstrates control. If your buddy pulls of a trick shot and you think it was a fluke, you ask him to try it again.
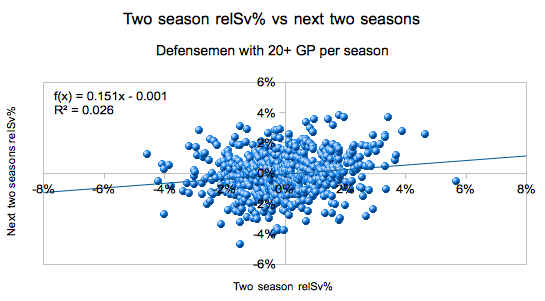
The image above is the statistical equivalency to asking your friend to repeat that trick shot. This is 575 samples of a defenseman’s relative save percentage versus the next two seasons thereafter. Two seasons were used to help diminish the variance voodoo that is goaltender save percentage.
Ultimately, defenders fail in being able to sustainably improve or worsen their goaltender’s save percentage. The model only explains 2.6% of the outputs.
Coefficients of determination are not naturally intuitive to most people. So, why is the model’s weak R2 an issue? Let’s look at the same data in a different way.

All player seasons were ordered from the lowest to highest relative save percentage and then split into groups of 58-59. The relative save percentage was then averaged between the players from each group for their first two seasons and then again for the next two. This was a strict average of relative percentages, although a more thorough analysis would use the relative save percentage of each group as a single entity.
The 10% of players with the most extreme negative impact in their first two seasons end up having no impact on average over the next two seasons. In contrast the 10% of players with the most extreme positive impact in their first two seasons end up with a positive of about +0.005, less than 20% of the impact the previous two seasons.
David Johnson recently responded to some criticism of the low repeatability of relative save percentage by indicating (rightfully) that hockey is a team sport and so there are multiple variables that affect all numbers. He added that players have an impact and therefore it is important. The problem with this is analytically having an impact is not enough. The impact must be significant enough that you have over a certain level of confidence in the number.
When you evaluate a player statistically you cannot extol or condemn a player for something that could equally be their fault as it could be a number of other factors.
There are three consequences to this discovery. One, as already discussed, that defensemen’s control of save percentage is minimal enough that adding on-ice save percentage effects do not add value in player evaluations other than looking at those likely to regress to the mean. Two, that a defender’s impact on shot metrics (specifically looking at both Corsi% and relCorsi%) is (currently) still the best way to approximate a player’s value in outscoring. Three, that for the most part a goaltender owns their save percentage (once sample is large enough).

“When you evaluate a player statistically you cannot extol or condemn a player for something that could equally be their fault as it could be a number of other factors.”
This is the crux of the debate. While you say the above (which I technically agree with), I am also saying say that you cannot conclude that a player has no ability to influence an outcome by conducting a correlation analysis on something “that could equally be their fault as it could be a number of other factors.”
Because of that, I will claim that your “three consequences to this discovery” are unproven at best and wrong at worst.
My hypothesis is that through some combination of talent and style of play players do have the ability to influence on-ice save percentage. The supporting evidence I have is two fold: 1) Teams do suppress shooting percentage (while giving up more shots against) when protecting a lead and 2) I have identified a number of players that have consistently over a number of seasons posted on-ice save percentages significantly above or below that of their teams save percentages when they are not on the ice.
I think we need to spend a lot more time investigating how style of play influences players statistics, both shot attempt and percentage statistics. For me this is the next big step forward in hockey analytics. The zone entry projects are a part of that but I believe there is more we can extract from the existing NHL data and I intend to follow down that path. Let’s not cut the analysis short by premature conclusions like you have done above.
I never said they have no ability to influence the outcomes. I’m saying you can’t use on-ice sv%’s to measure their influence outcome. Large difference.
With a two year sample the two most severe outgroups ended up either having no influence or 20% of the previous influence and the model only has an R2 of 0.026 when combining two full seasons. That is extraordinarily small even for something that has 9 other skaters affecting the results. The reason is there is just too much white noise.
The consequences are true in current form. While I acknowledge that in the future it may change, currently this is the way it is. While some combination of talent and style have ability to influence on-ice sv% the measure is so inaccurate that adding the information actually decreases your accuracy in making conclusions on a player.
I just don’t know how you can be certain the impact is small. It may be awash in noise, but to assert it is “minimal” without attempting to quantify/account for the noise and to assert that a goalies save percentage is his own and can’t be influenced by the team considering the significance score effects have on save percentage seems like a stretch to me which is why I will continue to investigate.
As an aside, has anyone attempted to do a regression in corsiRel using only players that have change teams from one year to the next?
Regardless of the reasons why, in its current form on-ice sv% is not reliable enough to be used in analysis.
This is compounded with how relationship of past and future is actually weakened and become more random once you take into account other factors such as TOI (like Michael Parkatti found).
Meanwhile Corsi% actually becomes more reliable once usage affects are accounted for (like Stephen Burtch found).