

Graph courtesy of @MannyElk
ABSTRACT
Shot quality versus quantity was once debated intensely in the hockey analytics blogosphere; however, this has since diminished severely. Still, many in the general public struggle with the idea of something that is important for players and teams to strive for doesn’t add much in data analysis. This exercise helps demonstrate some of the concepts using data.
INTRODUCTION
The relationship between shot quality, scoring chances and shot metrics have been tolled over by many for many years. The general trend thus far has been that shot quality exists but the amount of variance effects in shot location makes it difficult to determine how much of shot quality is skill and how much is chance. It has also been noted that the difference between scoring chances versus shot metrics is small and that this difference is fairly unsustainable from season to season. You add all these factoids together and it becomes apparent that -while shot quality differences exists- it does not add overwhelming increases in discovery to shot metric analysis.
It can seem counter intuitive. How does something that players strive for and so important in the game end up not overwhelmingly important in analysis? Perhaps an exercise in showing the difference throughout the league can help illustrate these factors. This idea was spurred from Manny’s graph above.
Warning: There are a lot of sampling issues with this data, which will be explored further in the discussion section. This is merely meant to be an exercise.
METHOD
From Greg Sinclair’s Super Shot Search, the even strength road shots and goals against were mined for each team as of 04:00 of March 27, 2014. Shots are given an X,Y coordinate in SSS and therefore shot location is estimated. It has been proven that home-scorers are infamously bad at providing the true shot location; however, the coordinates are accurate enough for this exercise, especially with only road data being used (so multiple scorers for each team).
Some shots are without X,Y coordinates, and these ones were removed from the data (denoted as “SA”). SSS gives a “scoring chance” option, where all shots outside of the “slot” area are removed. The even strength road shots and goals against were again mined for each team with this option selected (denoted as “~ScA”).
A league wide shooting percentage was calculated for all shots, “scoring chances” and “non-scoring chances”, and also the ~ScA/SA% for each team and the league was calculated. From these numbers you can calculate the difference in a team’s ~ScA/SA% relative to the league. Then using the league ~ScSh% you can estimate how many goals that difference in “scoring chances” is different by.
RESULTS AND DISCUSSION
Figure 1: League results

While the actual shot coordinates may be flawed due to bias, they do pretty well in at least separating high percentage shots. Of course, some of this is likely due to the sampling bias. For example, a shot that ends up as a goal near the edge of the scoring chance area is probably more likely to be considered closer by a scorer than a shot from the same spot that a goalie saves with ease.
Figure 2: Team results
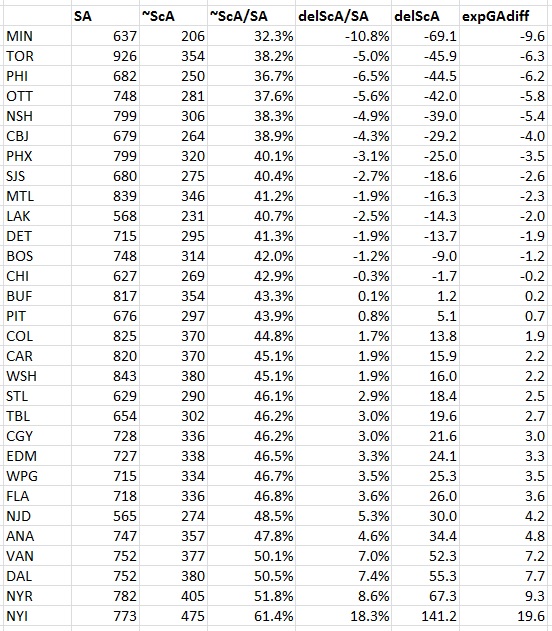
Already you can see some of the problems. The order of team doesn’t pass any sort of eye test. While the eye test and statistics won’t always agree, they should have some general following. However, this is an exercise in showing how shot location changes goal differentials, not how much this adds into team analysis. So, we can completely ignore how silly it looks with having the tire-fire that is the Buffalo Sabres as league average defensively, or Edmonton Oilers out of the bottom five, or neither Los Angeles Kings or Boston Bruins in the top 5. Also, yes, New York Islanders did come out with those numbers and they are just ridiculous to comprehend as a real evaluation of talent or system… but back on topic.
Figure 3: League distribution histogram
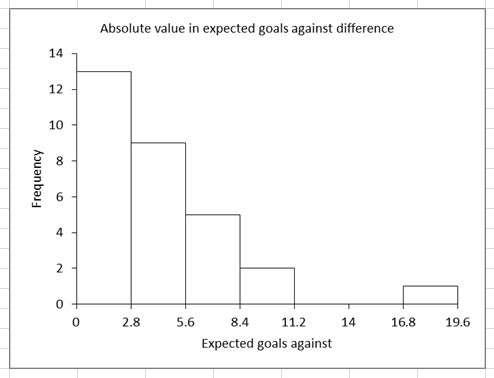
About seventy-five percent of teams are expected to gain or lose 5.6 goals against or less over their entire season on the road. Add in that factors like variance, bounces, scorer bias, differences in team’s travel, and that the other team on the ice has a part to play in shot location and you can see how limiting this information can be.
CONCLUSION
Wisely, Eric Tulsky once stated:
In general, shot quality factors tend to be small enough that they don’t grossly alter our understanding of the game, and they tend to be swamped by noise during in-season analysis. The best possible understanding obviously requires more than a cursory glance at shot totals, but shot-based analysis has consistently proven to be a strong approach to identifying talent and predicting outcomes.
In this exercise we see an example of this. Shot quality by shot location shows a difference in the goals against a team expects. The difference for the most part is quite small and doesn’t quite align in any general trend with expectations. Once you add in the unsustainable nature of scoring chances being a percentage of a team’s shot metrics and that scoring chances have over an .80 R^2 relationship with shot metrics, there isn’t enough information added in that shot metrics are useless without it.
To correct for one straw man argument often used: just keep in mind it doesn’t mean shot quality is not important on the ice. What is important to strive for by the players and teams is not the same as what is important in analyzing data.
However, one day video software akin to what is currently being used in basketball will allow for more accurate data. This added information though will likely not overturn shot metrics, but rather improve upon while allowing data to be more informative for teams in improving their players and system.

Does this analysis take screens into consideration? Because that would skew the results considerably since that’s how a lot of goals are scored in the NHL. I would define a long range shot that the goalie is never able to see because of a screen as a quality shot but the statistics can’t reflect that.