Cowritten by Brendan Kumagai, Mikael Nahabedian, Thibaud Châtel, and Tyrel Stokes
This is part 2 of a two part series introducing our Bayesian space-time model for evaluating offensive sequences and player actions. In part 1, we outlined our methodology to build the model and explained the reasoning behind the key metric, Possession Added Value (PAV), derived from it. In this second part, we will illustrate how our model and the PAV metric can be used for team and individual player analysis. Read Part 1 here.
Introduction
Since the Big Data Cup in March, our team has continued to improve the model to better estimate Possession Added Value of offensive sequences. With some extra time on our hands we cleaned up a few coding bugs and made two changes to the underlying models themselves. First, we have explicitly separated failed and completed passes. Second, we drastically improved our models which predict the location of the next event. With these changes we are able to more realistically simulate play sequences and more accurately value passing and as a result the findings presented below might differ a bit from our Big Data Cup paper.
Cowritten by Brendan Kumagai, Mikael Nahabedian, Thibaud Châtel, and Tyrel Stokes
Introduction
This is part one of a two part series introducing our bayesian space-time model for evaluating offensive sequences and player actions. In this part we describe the model and the key metrics derived from it. In part 2 we will show how the model can inform and integrate with player and team evaluations.
Hockey is a game of making the best possible decision in the shortest amount of time. Players need to react quickly to form a chain of plays to create valuable scoring chances. Our goal is to quantify the value of player actions as a function primarily of space and time in the offensive zone. This is to recognize that the puck location and the threat-level it poses to the opposition is a key driver of what options will be available to the puck carrier and – as a result – what is likely to happen next. Ultimately, we want to credit players that are able to make high quality decisions and difficult plays which advance the puck into more valuable locations on the ice.
To this end, we primarily build off of 3 previous papers. First, we use the conceptual framework of understanding play sequences in hockey (Châtel, 2020) from our team member Thibaud Châtel. Second, we adapt the multi-resolutional Expected Possession Value modelling framework pioneered by Cervone et al. (2016) in basketball to work with the detailed play-by-play data generously provided by Stathletes as part of the Big Data Cup hackathon. Finally, using this infrastructure we propose a metric called the Possession Added Value (PAV) based on Karun Singh’s Expected Threat Model in soccer (Singh, 2018) which has previously been adapted to hockey (Yu et al., 2020).
Due to the timeframe of the competition and the complexity of our proposed model, we decided to narrow our scope down to offensive even strength sequences that begin with an entry and end with either a shot or a whistle. By only considering offensive sequences the model as it stands can only properly evaluate the actions of the offensive team.
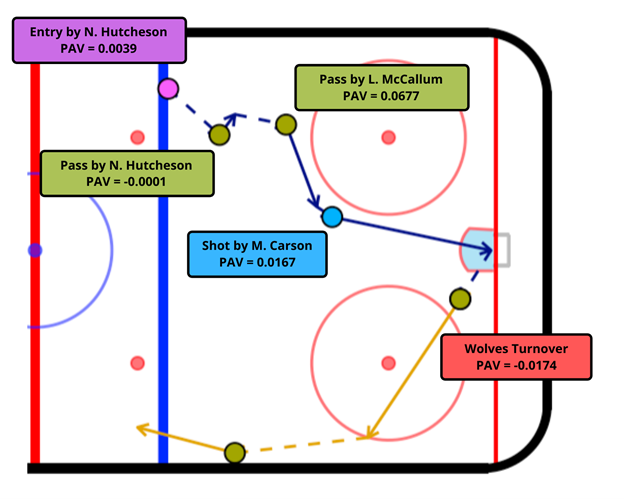
Before we dig into our methodology, here is an example of what our end product will look like in Figure 1 below. We assign each event in this entry-to-exit/whistle sequence with our Possession Added Value (PAV) metric, which can be thought of as the increase in probability that we score in the sequence by performing the observed action. For example, the pass by Landon McCallum from the top of the left circle into the slot adds 0.0677 goals to the expected value of the possession.
Figure 1: An offensive zone sequence with our Possession Added Value (PAV) metric