SUNRISE, FL – JUNE 27: the Boston Bruins during the 2015 NHL Draft at BB&T Center on June 27, 2015 in Sunrise, Florida. (Photo by Dave Sandford/NHLI via Getty Images)
The annual NHL draft has become a great source of entertainment for fans. Since teams make player selections based on a combination of game theory and data, the draft is also a fertile ground for analysts as well. Game theory specifically is the foundation for the Draft Probability Tool that will be presented in this piece. It will help you explore how teams should approach the draft strategically: if you’re interested in a specific player, do you need to trade up or down to get him? How much should you be giving up or asking for? How far should you trade up or down to still get the player you value highly? This tool helps answer those questions.
Methodology
This NHL draft tool is heavily inspired by Brian Burke’s work on the NFL Draft. It is a model based on Bayesian inference. In layman’s terms, it begins with a ‘prior’ probability distribution, which will be used as a reasonable first guess of where a given player will be selected. This guess is then refined as new information is added. The degree to which it is refined is a function of how reliable the new added information is.
For a prior estimate of when each prospect might be taken, I created a probability distribution centered around a consensus of best-player rankings. These rankings included the past five draft rankings of ISS Hockey, McKeens and The Hockey News. It’s important to note that this prior distribution is only as confident as these projections have been accurate in past drafts. In fact, the distribution is based on the errors of these rankings over the past four years. Therefore, the more accurate the consensus projections have been in the past, the more confident our model is with its future predictions. Also important to note that they don’t take into account team needs.
The size and shape of the projection curves that you’ll see in the Draft Probability Tool will vary on a player-by-player basis. That’s because the shape and size of the curves are a function of how confident the model is in a player’s projection: we know that as the draft progresses, the model becomes less and less confident in a player’s projection (ex. it’s easier to predict who’ll be selected 2nd overall than 22nd).
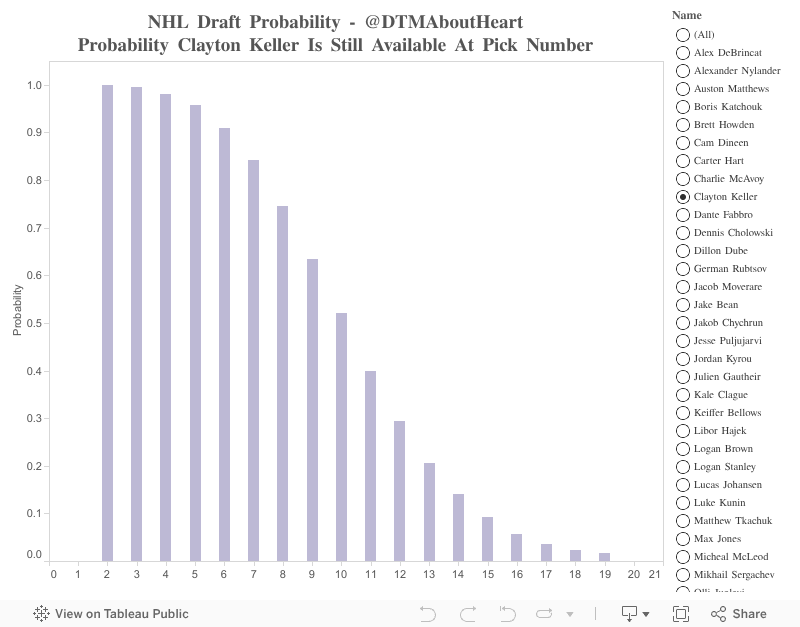
Each pick from 1-20 has a unique curve to reflect this change in accuracy. You’ll notice the probability that Auston Matthews is chosen 1st overall is ~95%. This high probability makes sense because pundits rarely mispredict the 1st overall pick. Picks 21-30 all share the same curve because our data becomes too volatile. The reasoning behind them having the same curve is illustrated in the following example: if we were to give picks 21-30 unique curves, we’d end up in a situation where being ranked 25th by a pundit can be better than being ranked 23rd because a player the pundit once predicted to be drafted 23rd overall actually got drafted in the 5th round (true story). This isn’t to say that players commonly ranked between 21-30 will have identical curves; each player’s final curve will be unique because no two players can receive the exact same rankings from all of our projection services. For example, a player who is ranked 22nd by Bob McKenzie and 24th by Craig Button will have a different final curve than a player who is ranked 24th by Bob McKenzie and 22nd by Craig Button.
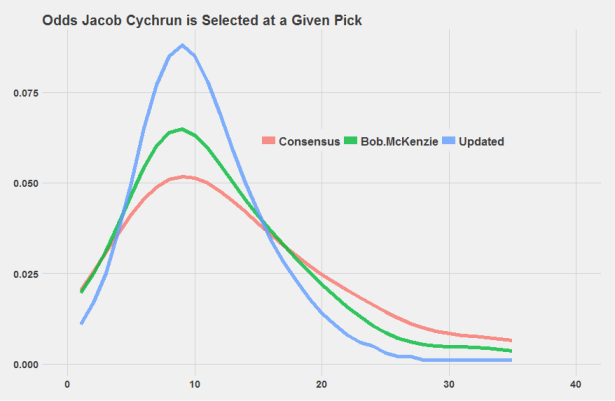
Using Bayesian inference, pundit draft projections starting with Bob McKenzie’s rankings were added. Keep in mind that the weight of each new layer of information is dependent on how reliable the information has been in the past. As an illustrative example, we present the probability distribution of Jakob Chychrun in the graph below. Note how when we added McKenzie’s rankings into the mix, our guess of where Chychrun will be drafted became more confident. We can see that McKenzie’s curve has a higher peak than the curve of our Consensus rankings and that is because McKenzie’s past projections tended to be more accurate than that of our Consensus rankings (at least in this specific range of picks). McKenzie’s curve is also centered more to the left than that of the Consensus since Chychrun is ranked 9th by McKenzie and 10th in our Consensus. When we combined the two rankings (as shown by the Updated curve), the curve became more narrow, which reflects the increase in confidence due to the combination of two projections instead of just one. The center of this curve also shifted to reflect that Chychrun was ranked 9th and 10th. We then repeated this process to include all five of our current draft projections (Consensus, Bob McKenzie, Craig Button Adam Kimelman and Mike Morreale).
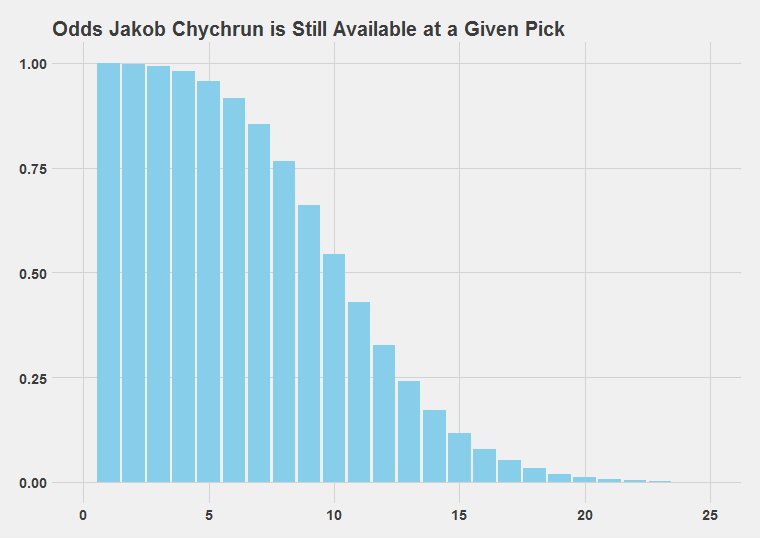
The good news is that we don’t have to be too concerned about exactly which pick will be used for a player. From a General Manager’s point-of-view, it’s valuable enough information to simply know whether a player will still be available at a given pick number. The last chart below takes the final result and turns it into what is called a cumulative probability distribution: it shows the probabilities that Jakob Chychrun will still be available at each pick of the draft.
Notes
Below is a Tableau visualization of the draft tool with separate tabs for the player and team’s perspective. Once again, big thanks to Brian Burke for sharing his methodology, which we used in this tool.
When looking at the Tableau, do not miss the team perspective tab. It shows the probability of availability for the top remaining prospects for a chosen pick number. Teams with multiple first round picks will have a 2 following their name to designate their extra pick (ex. Carolina Hurricanes 2). This page also has some additional filters to accommodate more specific queries (ex. if you wanted to look at the best defenceman and/or OHL player who will probably be available at the specific pick).
We hope you’ll enjoy this probability tool. It is a great tool for fans and hobbyists alike to use, but it still has room to improve. One way to do so is adding more (extensive) NHL Draft rankings from the past four years to the model. If you have access to or know where to find them, please contact me via e-mail dtmaboutheart@gmail.com or my twitter @DTMAboutHeart. You can also message me if you run into any issues with this probability tool.
Special thanks to Asmean for her help.