
Analytically-minded hockey people, as a group, tend to dismiss the eye test as biased. There is, of course, some truth in that position. “What you see is not all there is.”
However, I think it would be misguided to look at traditional viewing-based scouting and saying that it just doesn’t work. We shouldn’t forget what makes a human being different – and, in some ways, better – than a machine.
There is no camera as versatile as the human eye, and there is no computer as sophisticated as the human brain. So instead of disempowering those tools, why not try to make them better?
Let’s go back to high school for a second.
Think back to who the best students in your classes were. Chances are, they were the students taking the best notes during lectures. Not the ones sitting idly in front of an empty notebook, but not the ones jotting down the teacher’s ramblings word-for-word, either. The best note-takers focus on the essentials of the class material, and create a manageable quantity of high-quality insights that still make sense months after the fact, when it comes time to study for the final.
And I think the same thing applies in hockey. To be a better student of the game (a must if you are coaching or scouting at any level), you should try to become a better note-taker.
Some smart young scouts at the Major Junior and US high school levels have started tracking Corsi% for individual players, which is an incredibly useful thing to do especially when league-level statistics are not nearly as complete and as accurate as at the NHL level. Hockey-Graph’s own Nick Mercadante (https://twitter.com/NMercad), a former coach, has a lot of concerns about the quality of statskeeping at the high school level impacting the future prospects of its best players, and it’s a concern that I share.
All this is say that if you want something done well, you should aim to do it yourself. Not only will tracking statistics in a more detailed manner help a scout better remember what s/he saw through the course of a season, but in larger hockey organizations, it will also create a powerful network effect, thereby the notes of five, 10 or 20 scouts can be seamlessly combined, allowing for prospects to be compared on an apple-to-apple basis over several different years.
Below are two technologies (“Apps,” if you will) that I like to use when scouting players. You won’t need a smartphone or a tablet to run these apps. All you’ll need is a pen, a sheet of paper, and an attentive pair of eyes.
Defensemen
Having tracked various microstats for defensemen in the last couple of years, it is my belief that what separates good blueliners from bad ones can generally be identified at their own blueline.
If you think about it, a defenseman’s most important role offensively is to recover the puck in the defensive zone, and simply move it up to a forward who has time and space to make a play. S/he should act as a conveyer belt, efficiently and reliably transporting the puck up the assembly line, so that another player can go and finish the job.
Defensively, you want to look for a blueliner who can break the other team’s “conveyer belt,” either by proactively preventing a zone entry with a good pinch, or turn potential controlled entries into less dangerous dump-ins with a tight neutral-zone gap.
Combining these two ideas gives us a clear idea of what kind of notes we’d want to take: A count of controlled/dump/failed zone exits for and controlled/dump/failed zone entries against when Defenseman X is on the ice.
And it looks something like this (forgive my chicken-scratch handwriting):
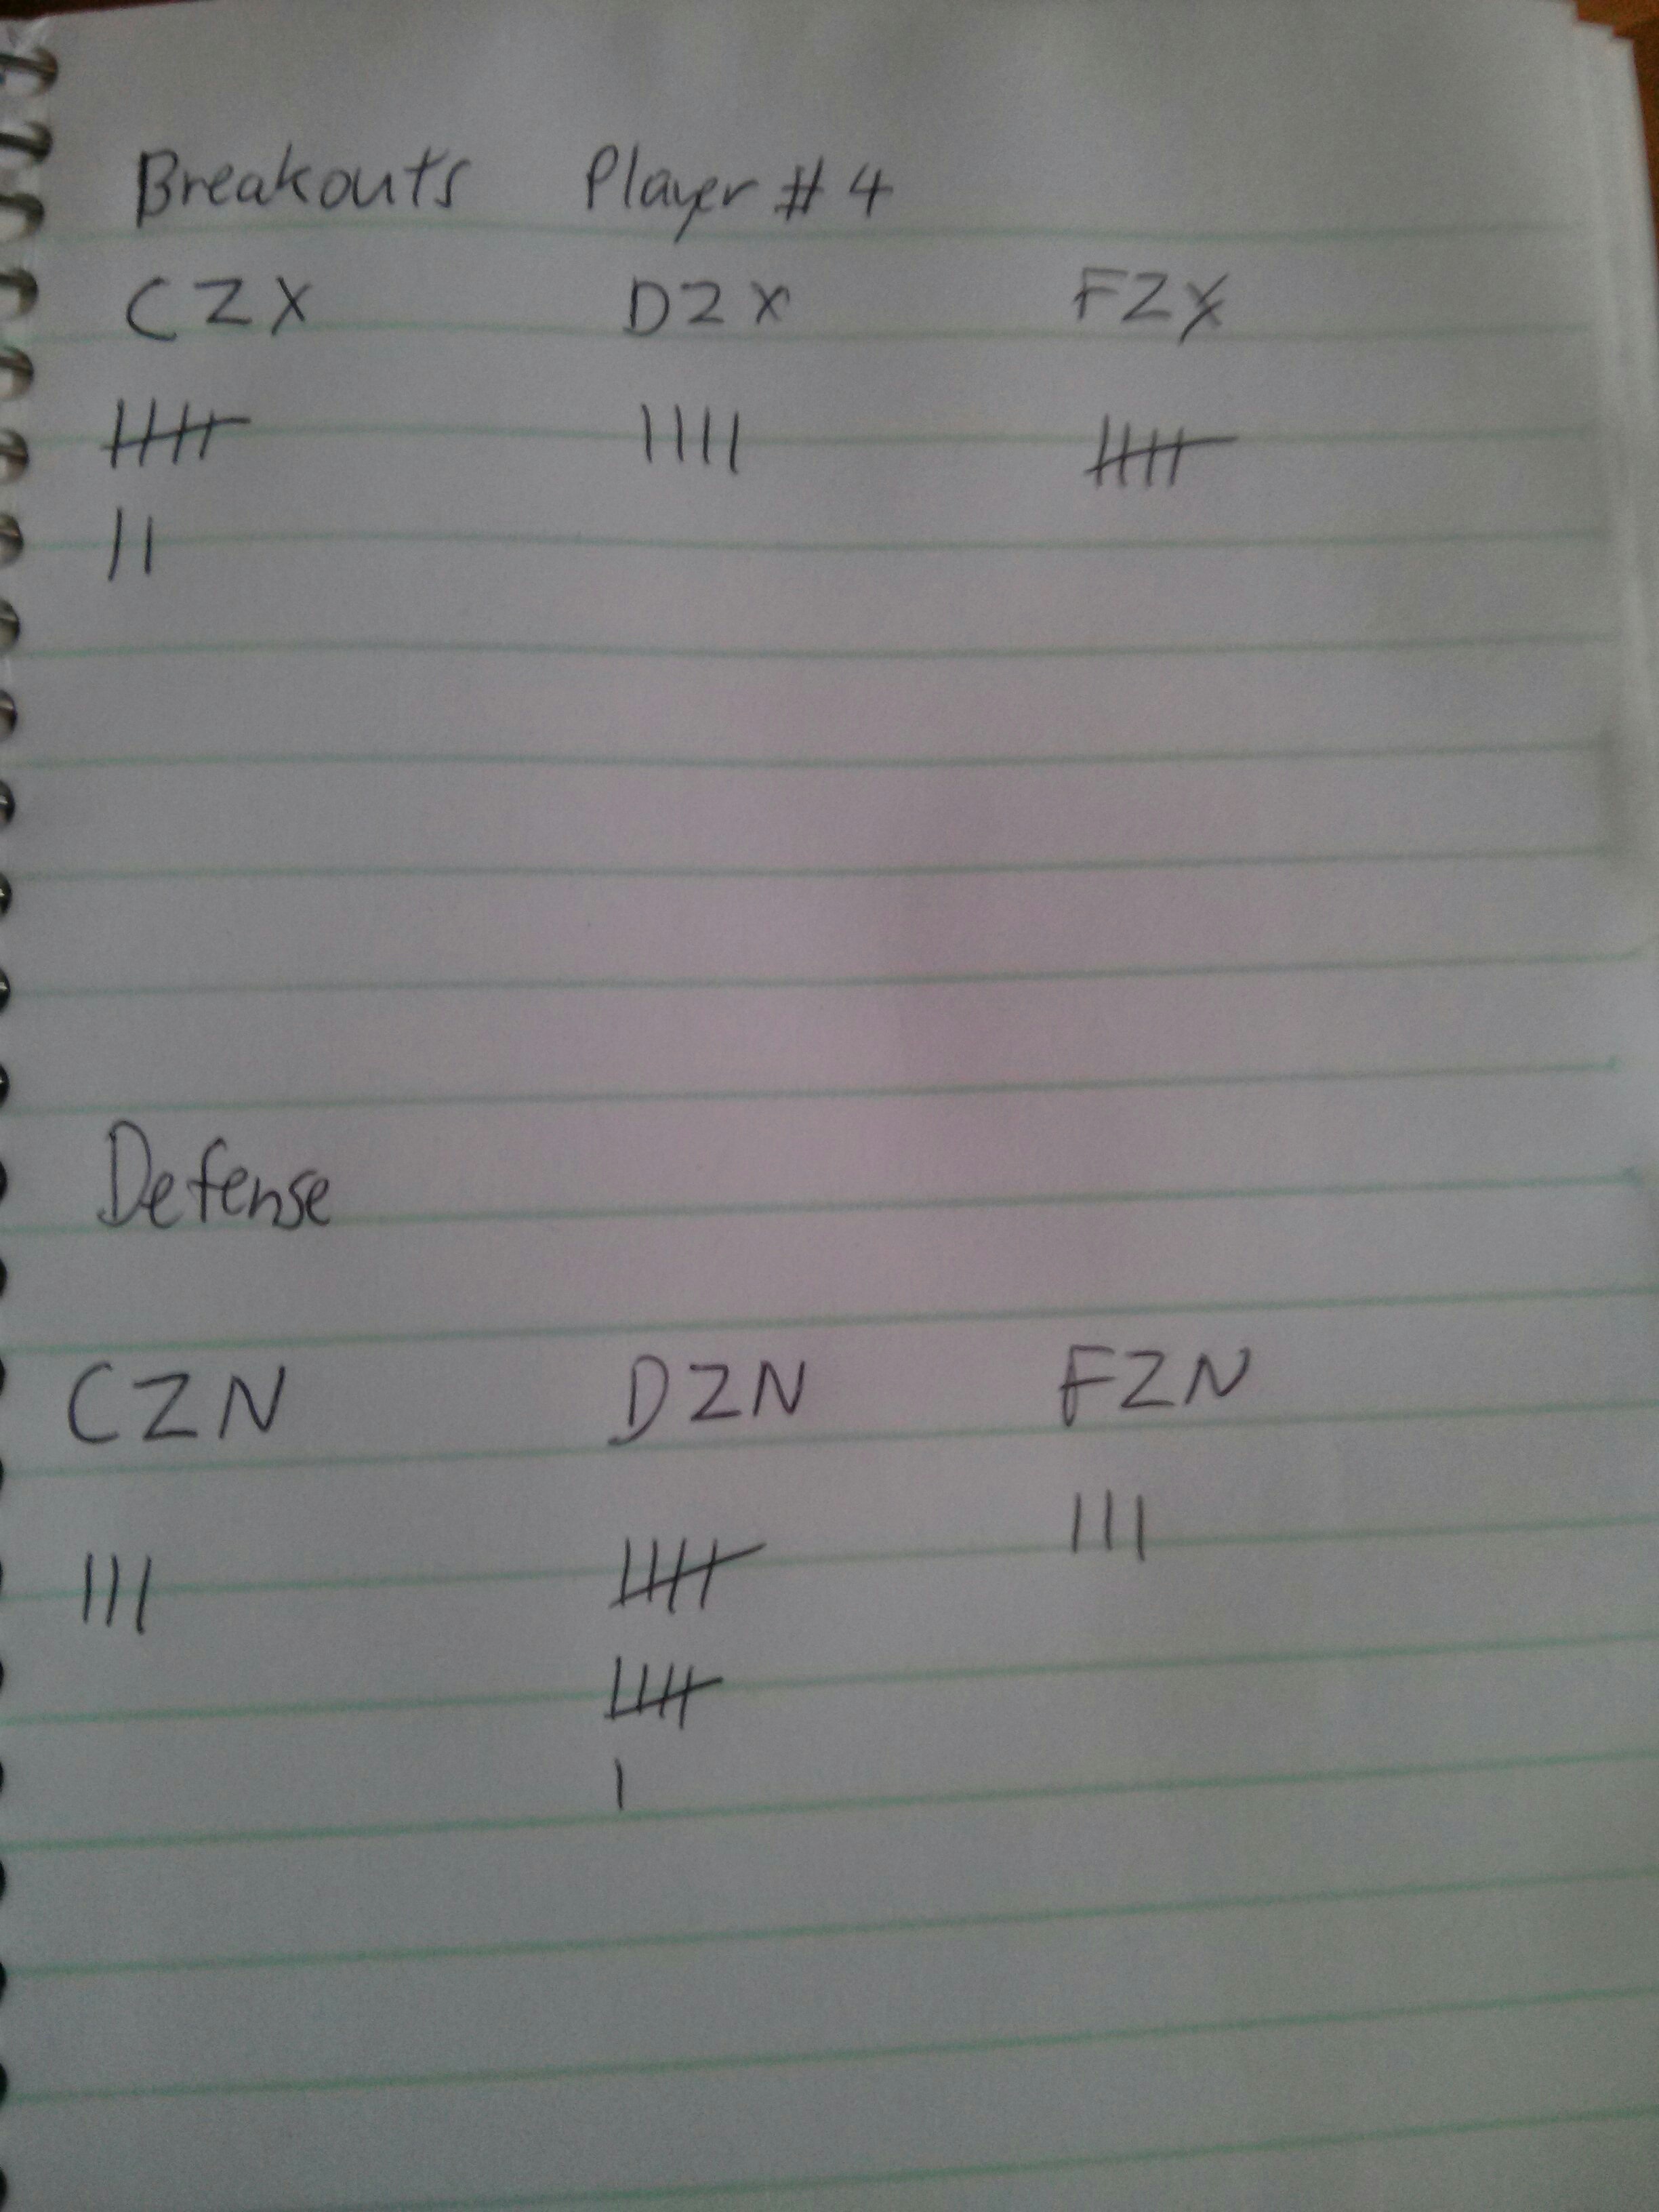
Not only does this tool give you a sense of how technically skilled a defender is, but it also allows you to understand his/her risk management. On the breakout, how many controlled exits (CZX) can she create while keeping failed exits (FZX) low? Without the puck, is he being too passive at his blueline, never getting burned but conceding too many controlled zone entries (CZN)? These are the type of questions that can help answer why a player has a good, or a poor Corsi%.
Forwards
In our simplified view of hockey, defensemen are simply the vessel in which a puck is moved up-ice, but forwards need to do a lot more than that. Past the offensive blueline, not only are we looking for players who can create a quantity of shot attempts, but also a quality of shot attempts.
When looking at the findings from Chris Boyle’s Shot Quality Project, Ryan Stimson’s Passing Project, and my own research at McGill, we start realizing that a relatively limited number of offensive actions (shots from the slot, Royal-Road passes) account for a disproportionate amount of goals scored, and a far larger number of offensive actions (point shots, weak-angle shots, etc.) don’t move the needle all that much despite being equally weighed in the possession count.
So, here we are looking to identify both the quantity and quality of a forward’s offensive contribution. Here’s how I do it:
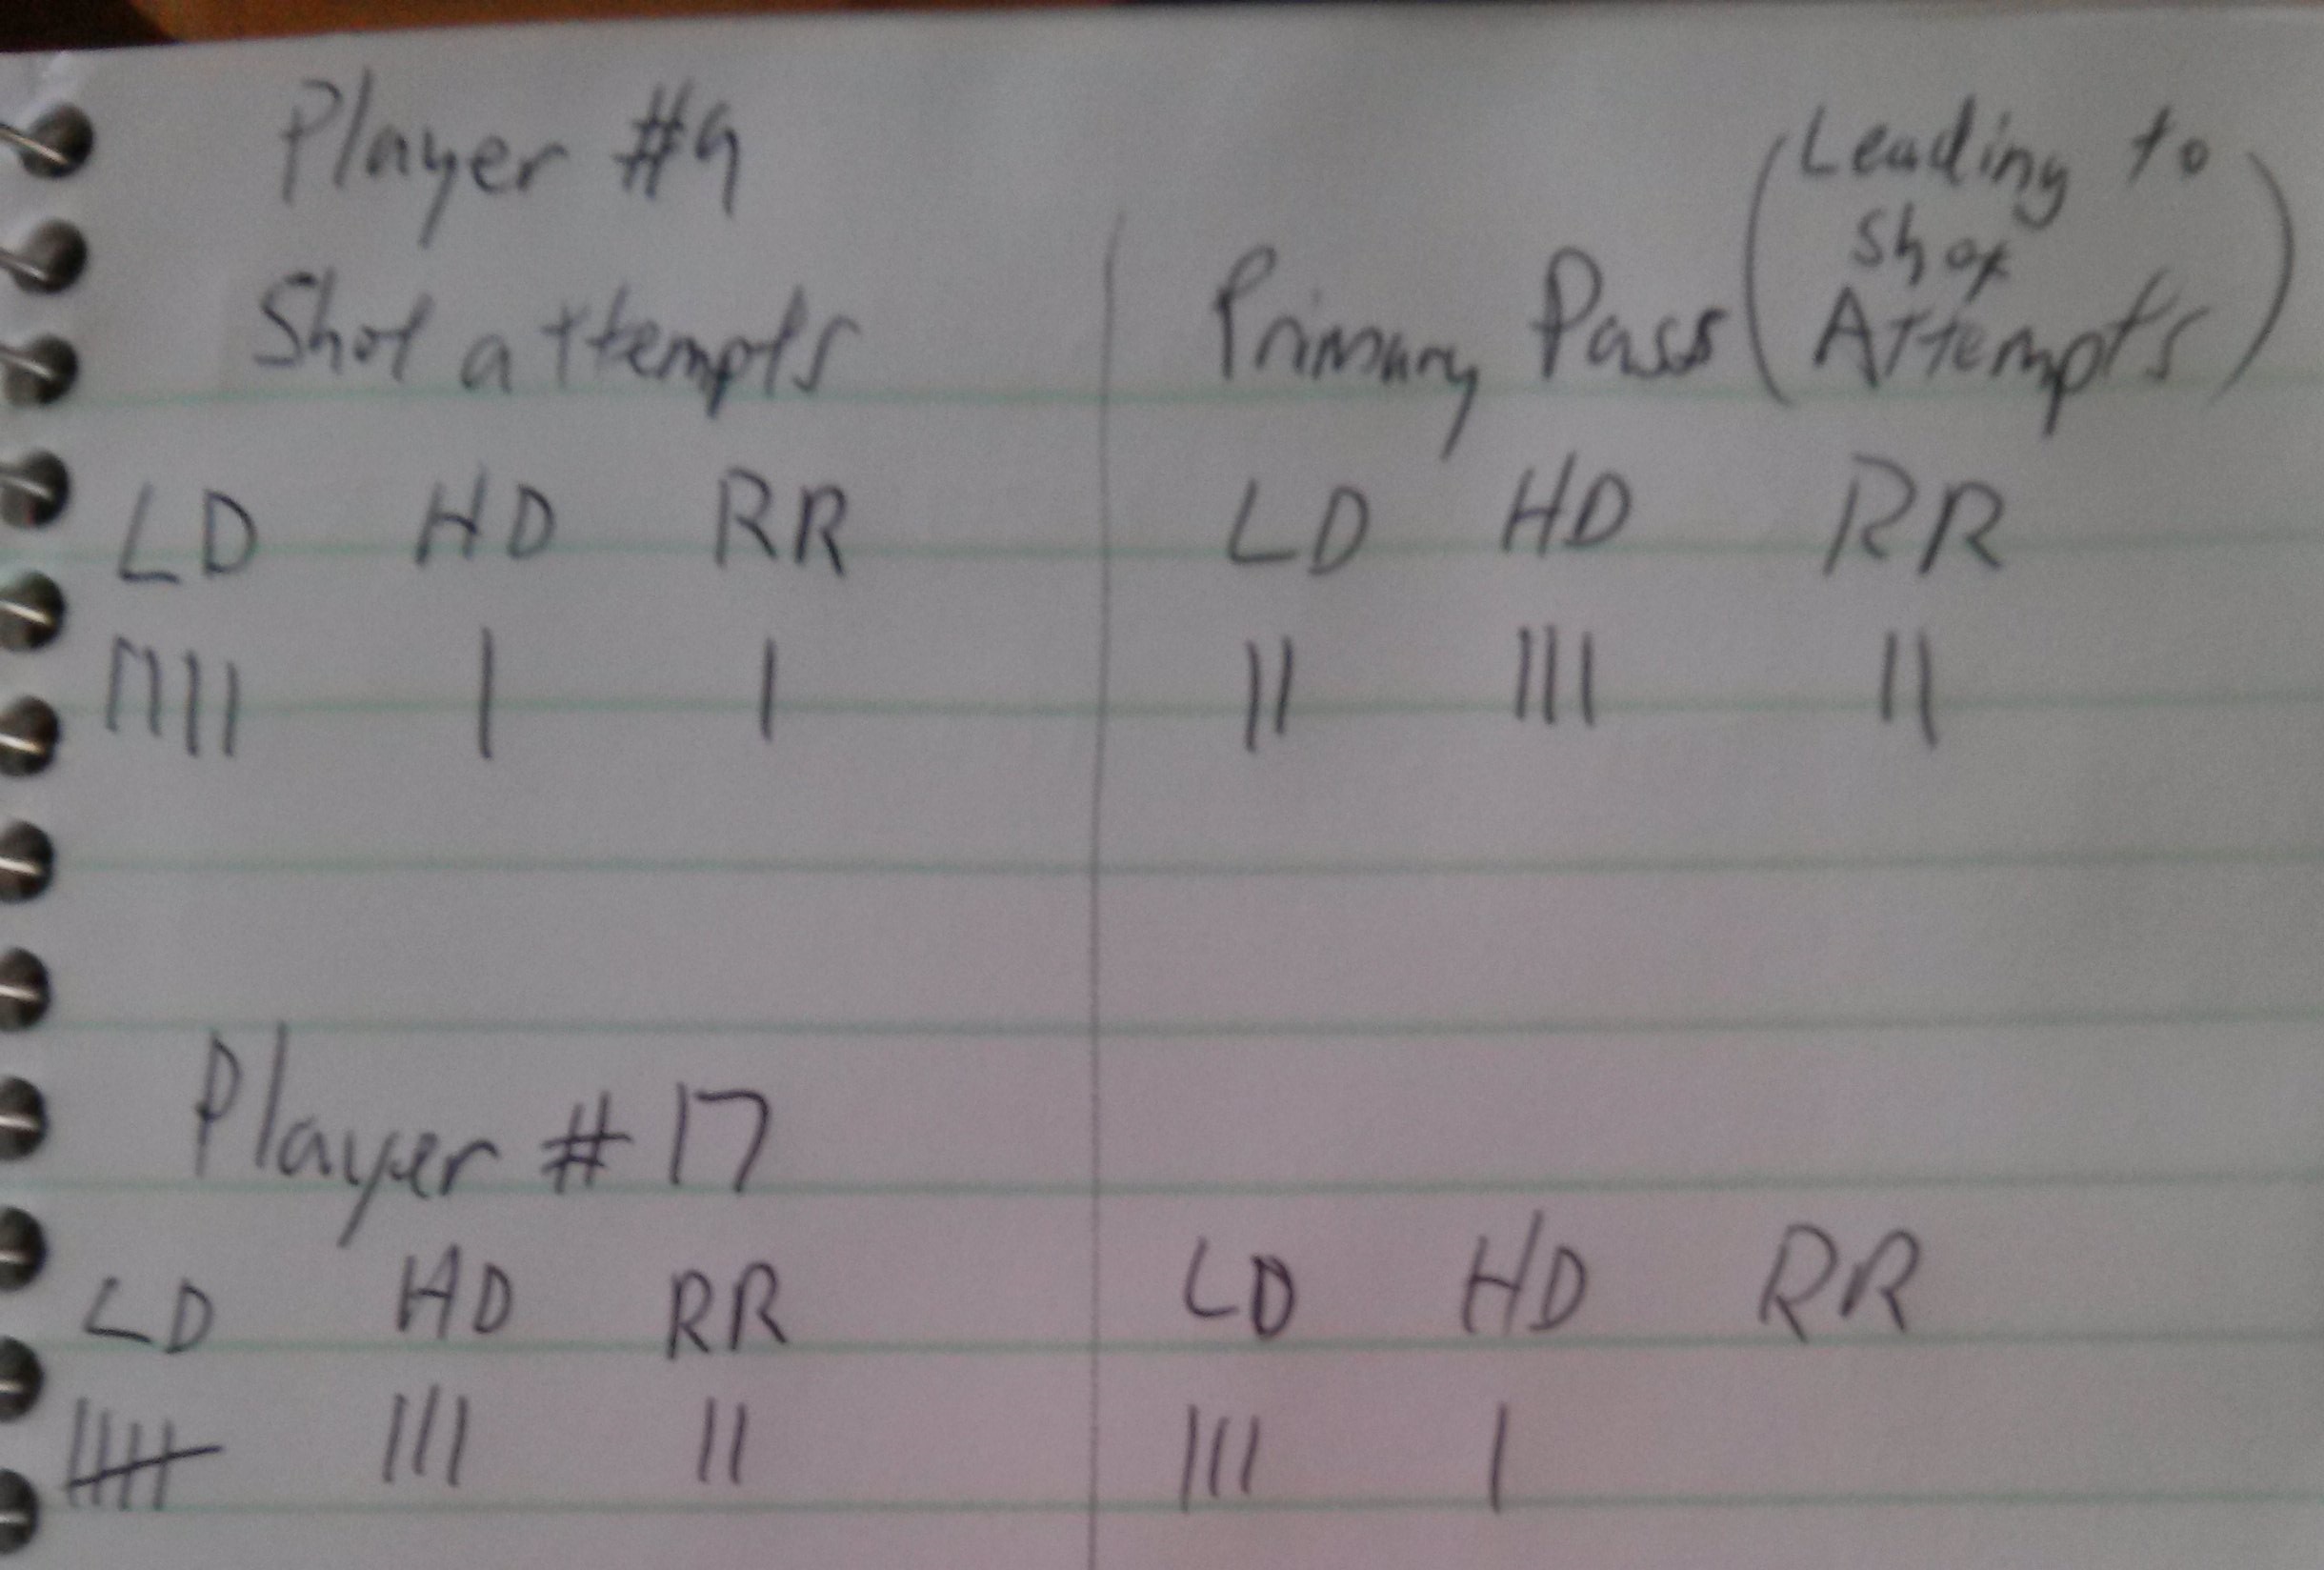
Looking at the numbers, you may already start to see that Player #9 is a playmaker who is skilled at setting up scoring schances, while Player #17 is a volume shooter. As you track more games throughout a season, you could have a better chance of identifying which of these two player is really “driving the bus” offensively, and is more likely to excel at the next level.
***
Jack Han is the Video & Analytics Coordinator for the McGill Martlet Hockey team. He also writes occasionally about the NHL for Habs Eyes on the Prize. You can find him on Twitter or on the ice at McConnell Arena.
